Pre-Summer Sale Special - Limited Time 70% Discount Offer - Ends in 0d 00h 00m 00s - Coupon code: mxmas70

Home > WGU > Courses and Certificates > Applied-Probability-and-Statistics

Applied-Probability-and-Statistics Applied Probability and Statistics (FZO1 C955) Question and Answers

Question # 4

A 10-sided die is rolled in a role-playing game.

What is the probability of rolling a number that is a multiple of 2 or greater than 7?

A.

1/2

B.

3/5

C.

7/10

D.

4/5

Full Access
Question # 5

A marketing analyst is studying the relationship between customer age groups, teens, adults, and seniors, and their preferred shopping methods, online and in-store.

Which numerical measure is most appropriate for this study?

A.

Five-number summaries

B.

Mean difference

C.

Conditional percentages

D.

Correlation coefficient

Full Access
Question # 6

Sample correlation r = 0 →

A.

No linear relationship

B.

Strong positive

C.

Strong negative

D.

Perfect correlation

Full Access
Question # 7

Probability of drawing red card from deck = ?

A.

26/52 = 1/2

B.

1/4

C.

1/13

D.

1/6

Full Access
Question # 8

Dataset: 3, 6, 9. Median?

A.

6

B.

5

C.

4

D.

3

Full Access
Question # 9

In a game, a coin is tossed, and a spinner with 8 equal spaces numbered 1 through 8 is spun.

What is the probability of getting heads on the coin and a number less than 3 on the spinner?

A.

1/8

B.

1/4

C.

1/2

D.

3/8

Full Access
Question # 10

A t-distribution is used when:

A.

σ unknown, small sample

B.

σ known, large sample

C.

Population categorical

D.

Data continuous

Full Access
Question # 11

The dot plot illustrates the frequency of outdoor games played by students per week.

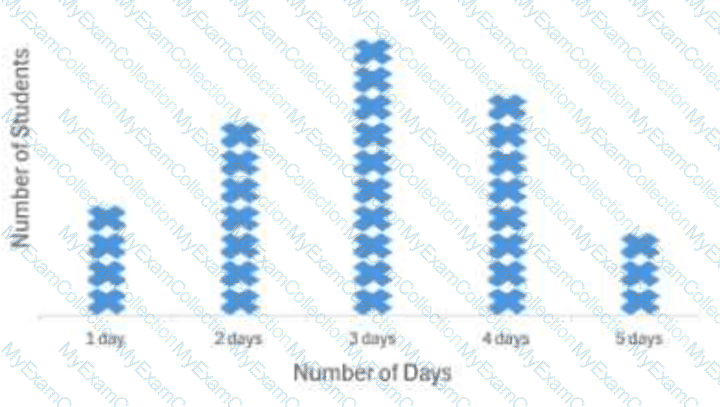
Which statement is true?

A.

The mean and median cannot be compared.

B.

The mean is significantly bigger than the median.

C.

The mean is significantly smaller than the median.

D.

The mean is almost the same as the median.

Full Access
Question # 12

Mean = 100, SD = 15, z = 2. Value = ?

A.

130

B.

115

C.

125

D.

110

Full Access
Question # 13

One-sample t-test compares:

A.

Sample mean vs known population mean

B.

Two independent samples

C.

Variances

D.

Proportions

Full Access
Question # 14

Best chart for categorical data?

A.

Bar chart

B.

Histogram

C.

Scatterplot

D.

Boxplot

Full Access
Question # 15

Histogram is best for:

A.

Continuous numerical data frequency

B.

Categorical data

C.

Scatterplots

D.

Boxplots

Full Access
Question # 16

Two independent events: P(A) = 0.3, P(B) = 0.2. P(A or B) = ?

A.

0.5

B.

0.06

C.

0.44

D.

0.1

Full Access
Question # 17

Standard deviation measures:

A.

Spread of data

B.

Central tendency

C.

Probability

D.

Count

Full Access
Question # 18

A hospital analyzes the recovery rates of patients undergoing two different treatments for a specific condition. Treatment X has an overall recovery rate of 80%, while Treatment Y has a recovery rate of 90%. However, when the data is divided by age groups, Treatment X has a higher recovery rate in each age group compared to Treatment Y.

Is Simpson’s paradox present in this study?

A.

No, because the study does not involve a confounding variable that affects recovery rates.

B.

No, because the overall recovery rate is higher for Treatment Y.

C.

Yes, because the recovery rates differ between the two treatments.

D.

Yes, because the overall recovery rates are inconsistent with the age group-specific rates.

Full Access
Question # 19

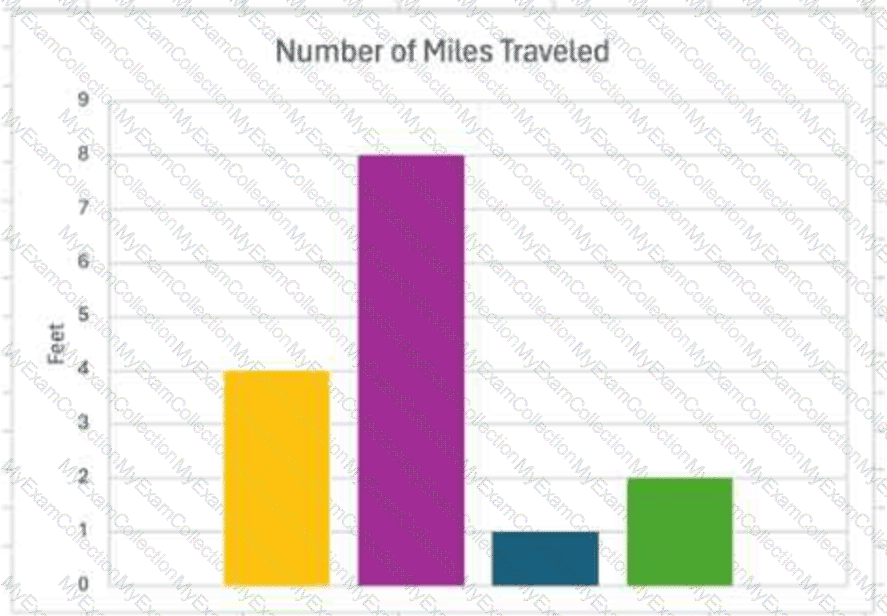
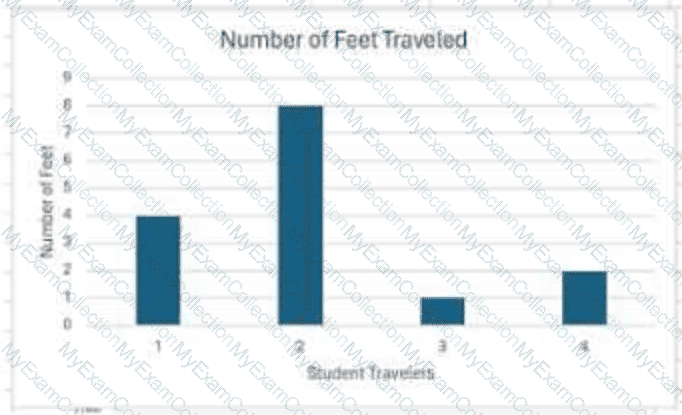
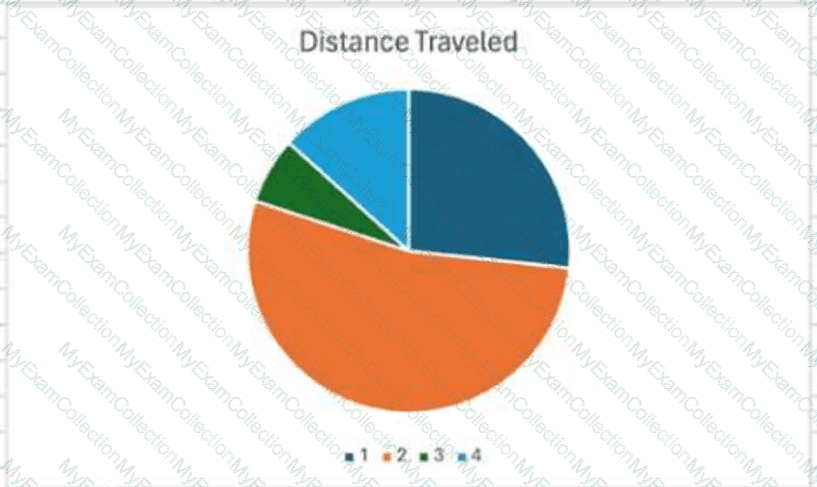
A study recorded the number of hours participants spent on exercise per week: 3 participants exercised for 1 hour, 6 participants exercised for 2 hours, 4 participants exercised for 3 hours, and 2 participants exercised for 4 hours.

Which type of graph would best represent the frequency of exercise hours?

A.

A line graph with points connected to illustrate changes in exercise hours over time

B.

A pie chart with slices representing the proportion of each exercise duration

C.

A bar chart with bars showing the number of participants for each exercise duration

D.

A scatterplot with points showing the relationship between exercise hours and fitness level

Full Access
Question # 20

Variance formula = ?

A.

Σ(xᵢ − x̄)² / (n − 1)

B.

Σxᵢ / n

C.

x̄²

D.

√Σ(xᵢ − x̄)²

Full Access
Question # 21

Correlation coefficient r = −0.9 indicates:

A.

Strong negative linear relationship

B.

Strong positive

C.

Weak negative

D.

No relationship

Full Access
Question # 22

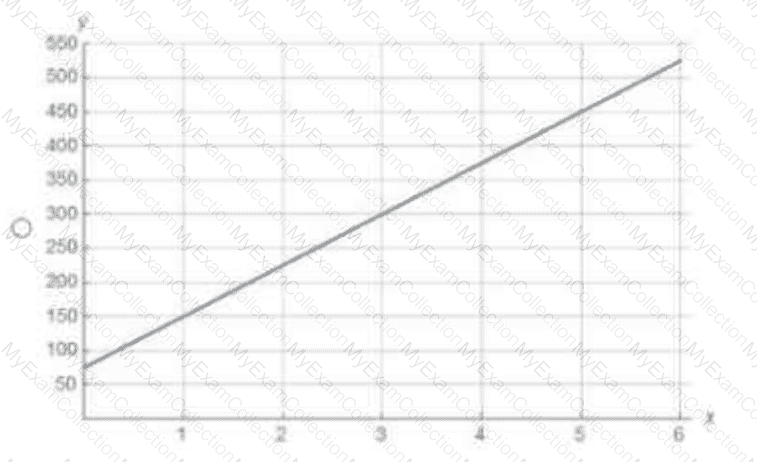
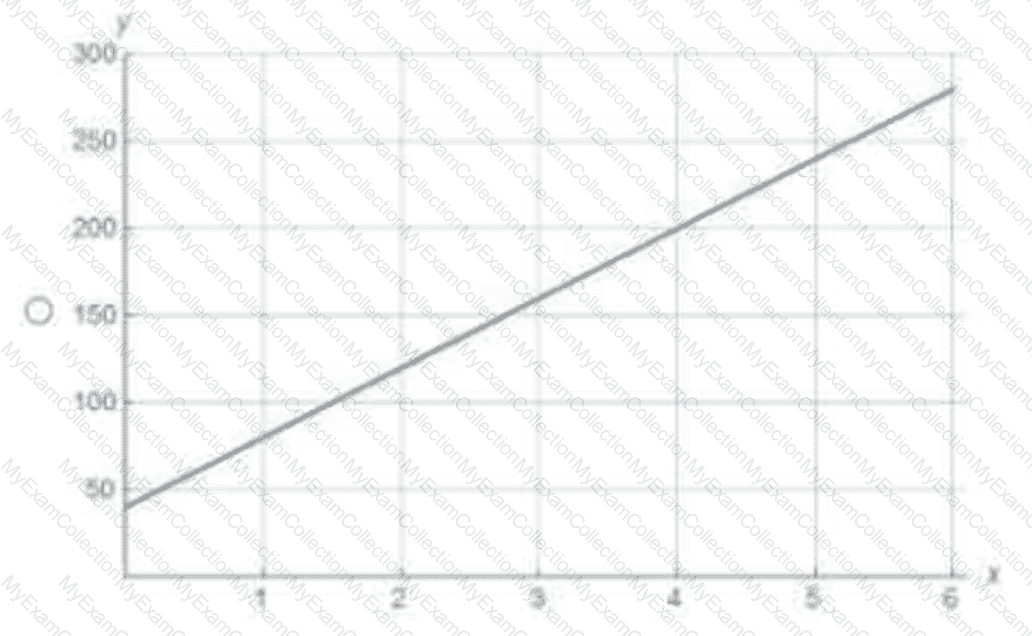
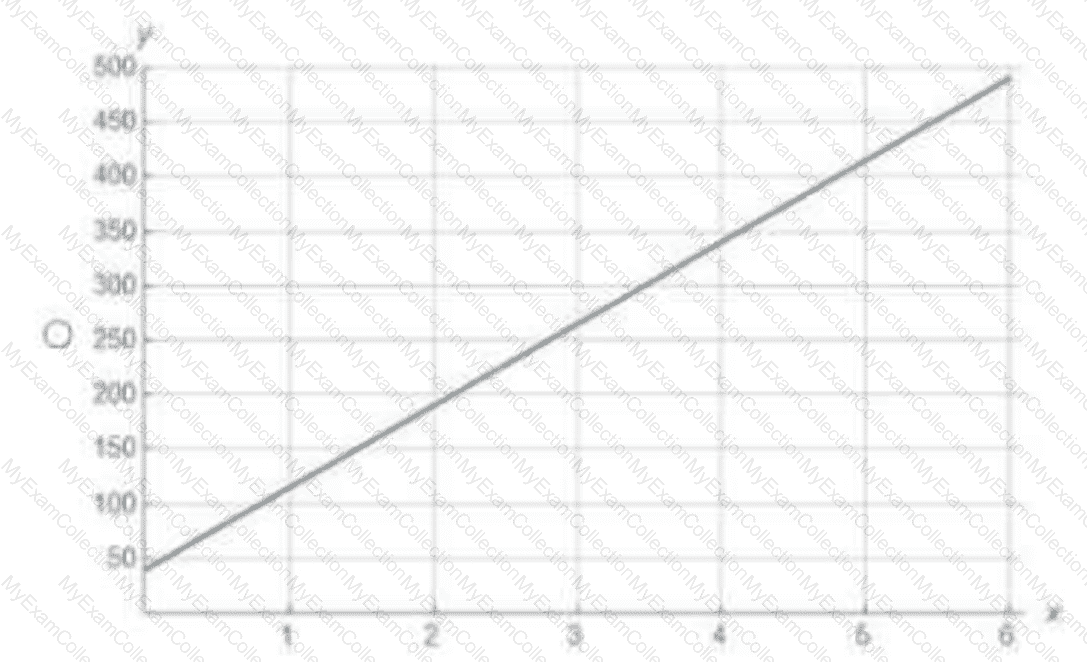
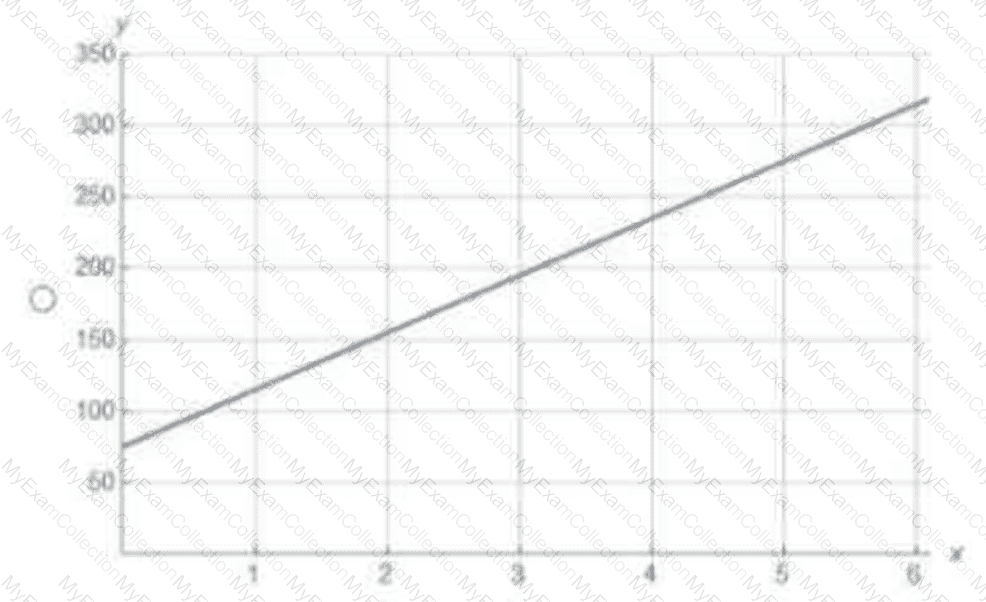
A recording studio raises its use fee to $75 and charges $40 per hour for studio time. The equation of the total cost of a recording session as a function of studio time is y = 40x + 75.

Which graph represents this equation?

A.

Graph 1

B.

Graph 2

C.

Graph 3

D.

Graph 4

Full Access
Question # 23

Probability of drawing red or black card = ?

A.

1

B.

1/2

C.

0

D.

0.25

Full Access
Question # 24

Regression slope indicates:

A.

Change in Y per unit X

B.

Intercept

C.

R²

D.

Correlation

Full Access
Question # 25

Empirical probability is based on:

A.

Observed frequency of events

B.

Classical calculation

C.

Subjective guess

D.

Theoretical models

Full Access
Question # 26

Variance of Poisson λ = 5 = ?

A.

5

B.

4

C.

0

D.

1

Full Access
Question # 27

Empirical probability = ?

A.

Based on observed data

B.

Theoretical

C.

Guess

D.

Uniform

Full Access
Question # 28

Which graph displays data in a manner that is accurate?

A.

Bar graph titled “Number of Miles Traveled,” with the vertical axis labeled in feet.

B.

Bar graph titled “Number of Feet Traveled,” with the vertical axis labeled “Number of Feet” and the horizontal axis labeled “Student Travelers.”

C.

Pie chart titled “Distance Traveled.”

D.

Line graph titled “Number of Feet Traveled.”

Full Access
Question # 29

Expected value = ?

A.

Long-term average

B.

Median

C.

Mode

D.

0

Full Access
Question # 30

Expected value of binomial X ~ B(10, 0.3) = ?

A.

3

B.

7

C.

10

D.

0.3

Full Access
Question # 31

Z-score formula = ?

A.

(x − μ )/ σ

B.

(x + μ )/ σ

C.

x/ σ

D.

μ / σ

Full Access
Question # 32

Sum of probabilities in sample space = ?

A.

1

B.

0

C.

> 1

D.

Cannot exceed 2

Full Access
Question # 33

95% confidence interval for mean = (45, 55). Which statement is correct?

A.

Population mean is 95% likely within interval

B.

Mean is 50

C.

Population mean always 55

D.

Interval is fixed probability

Full Access
Question # 34

Probability of drawing king or queen from deck = ?

A.

8/52

B.

4/52

C.

1/13

D.

1/26

Full Access
Question # 35

Probability it does NOT rain = 1 − 0.25 = ?

A.

0.75

B.

0.25

C.

0.5

D.

1

Full Access
Question # 36

Two dice rolled. Probability sum = 7?

A.

6/36

B.

1/6

C.

5/36

D.

1/12

Full Access
Question # 37

A school surveyed student participation in extracurricular activities. The survey found:

    The drama club had 50% of students participate.

    The science club had 30% of students participate.

    Both clubs had 15% of students participate.

What is the probability that a student participated in the drama club, given that they attended the science club?

A.

.15

B.

.3

C.

.40

D.

.5

Full Access
Question # 38

Standard deviation increases →

A.

Data more spread out

B.

Data closer

C.

Mean increases

D.

Variance decreases

Full Access
Question # 39

Probability of at least one six in 2 dice rolls = ?

A.

11/36

B.

1/6

C.

1/36

D.

25/36

Full Access
Question # 40

A researcher has collected information on students from a school. The researcher wants to display the ethnic groups represented in the school.

Which pair of graphs both display data in this manner?

A.

Pie chart and box plot

B.

Bar graph and pie chart

C.

Line graph and bar graph

D.

Bar graph and histogram

Full Access
Question # 41

Type I error = ?

A.

Reject Hâ‚€ when true

B.

Accept Hâ‚€ when false

C.

Correct decision

D.

Error in data

Full Access
Question # 42

A tech company surveys its employees to assess remote work preferences. The survey reveals that 55% of employees prefer working remotely, while the remaining employees prefer working in the office. Of the employees who prefer remote work, 75% report high productivity. Among those who prefer working in the office, only 50% report high productivity.

Which percentage of employees prefer working in the office and report high productivity?

A.

22.5%

B.

27.5%

C.

45%

D.

50%

Full Access
Question # 43

What is the result of 2/5 + 1/3 − 1/4?

A.

13/60

B.

11/60

C.

29/60

D.

19/60

Full Access
Question # 44

Correlation coefficient = −0.7. This indicates:

A.

Strong negative linear relationship

B.

Strong positive

C.

No relationship

D.

Weak positive

Full Access
Question # 45

A sociologist is investigating the relationship between educational level, high school, bachelor’s, master’s, and doctorate, and annual income.

How should this study be classified?

A.

Categorical→quantitative

B.

Categorical→categorical

C.

Quantitative→categorical

D.

Quantitative→quantitative

Full Access
Question # 46

A dataset: 4, 8, 12, 16, 20. Mean = ?

A.

10

B.

12

C.

14

D.

16

Full Access