Question # 4
A coach is placing an order for team shirts. The graph shows the total cost based on the number of shirts.
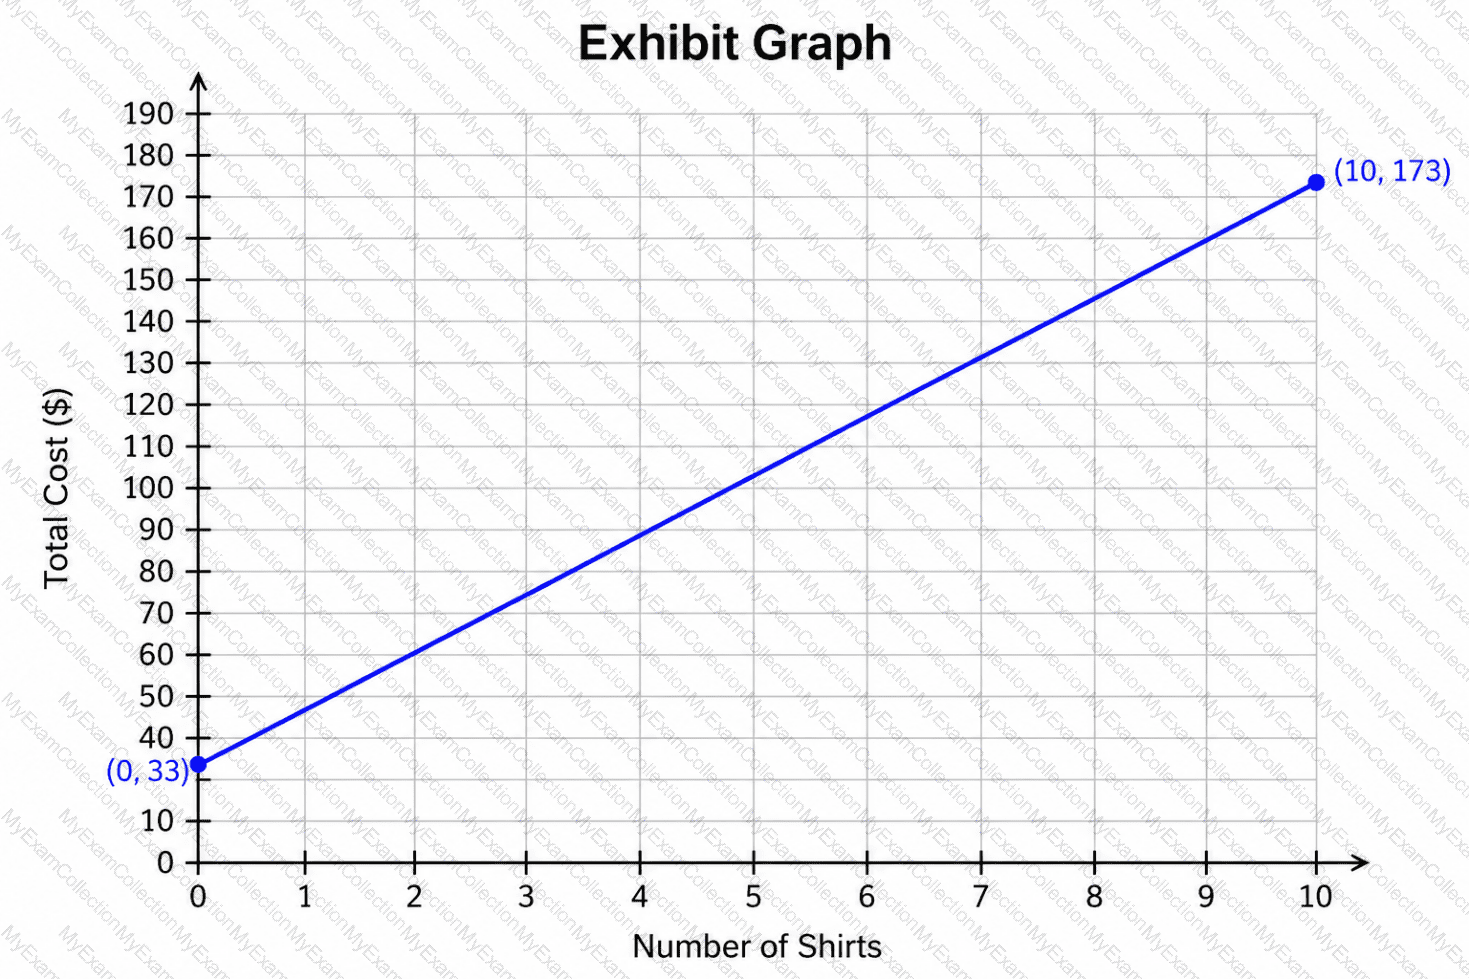
What is the cost of each additional shirt?
Question # 5
The graphed function v(t) represents the number of vehicles, v, stopped at a toll booth t hours after 6:00 a.m. The coordinates of points A and B are (1,49.4) and (4,45.8), respectively.
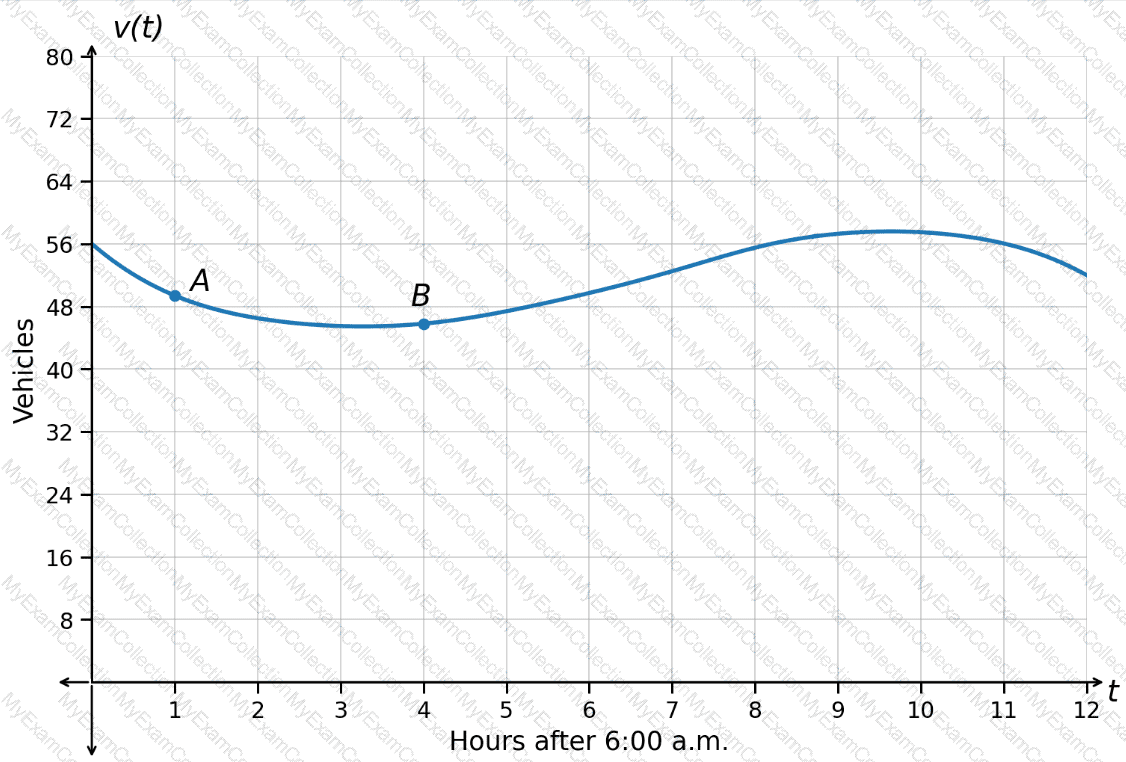
What is the average rate of change of the number of vehicles from point A to point B?
Question # 6
A vehicle is travelling away from a rest stop. The function
D(t)=48t+23
represents the distance from the vehicle to the rest stop at time t, where t is measured in hours and D is measured in miles.
What is the value of D(1.7)?
Question # 7
The number of letters processed daily at a mail center is modeled by the decreasing exponential function shown in the graph.
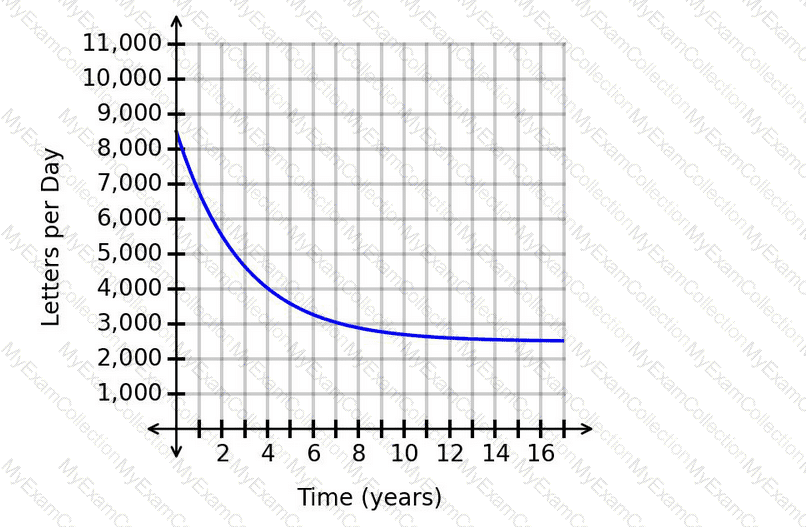
Which value is the number of letters processed per day trending toward as time progresses, based on the equation of the horizontal asymptote?
Question # 8
The logistic function f(x), whose graph is shown, models the number of people with a viral infection, where x represents the number of days since the outbreak of the virus and f(x) represents the number of viral infections.
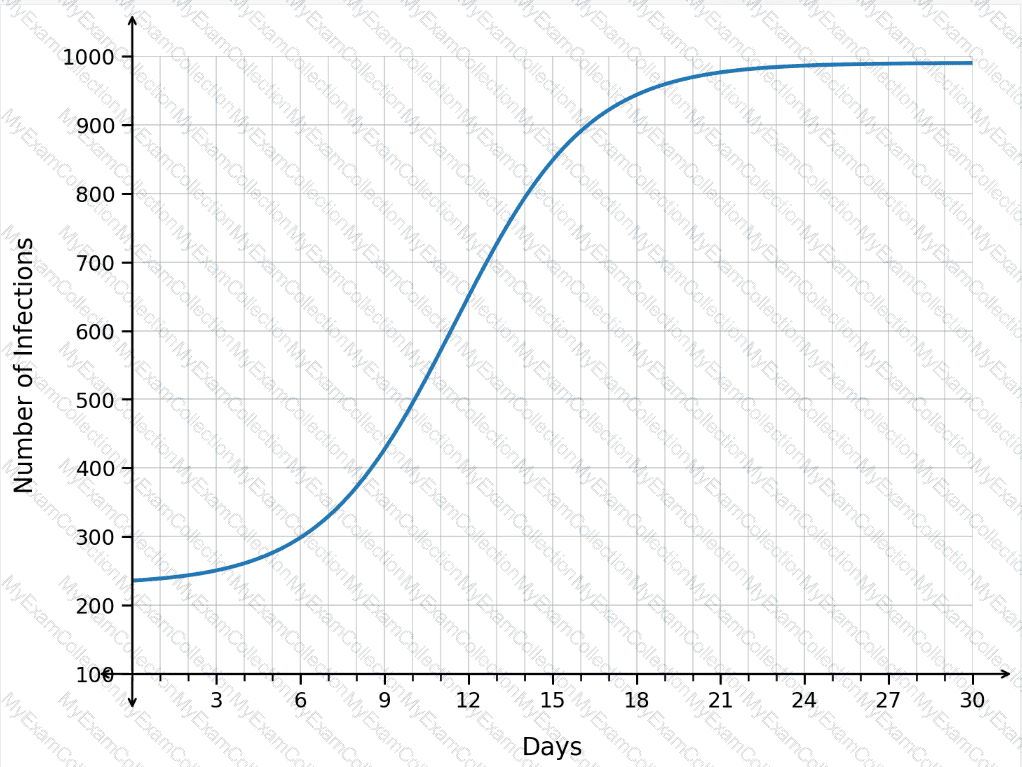
What happens as time progresses from day 9 to day 12?
Question # 9
The graph shows functions modeling the spread of two diseases within the same population.
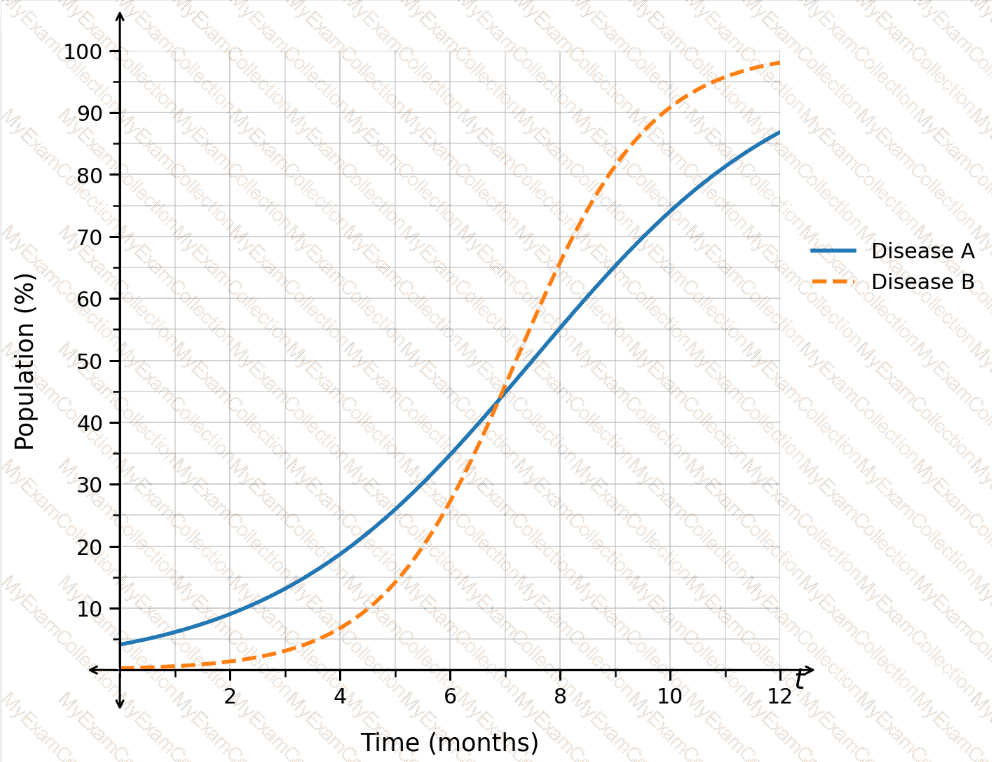
Which conclusion is valid?
Question # 10
The graph shows the progress of a manufacturing team, modeling the number of widgets the team is able to produce each day since the team was formed.
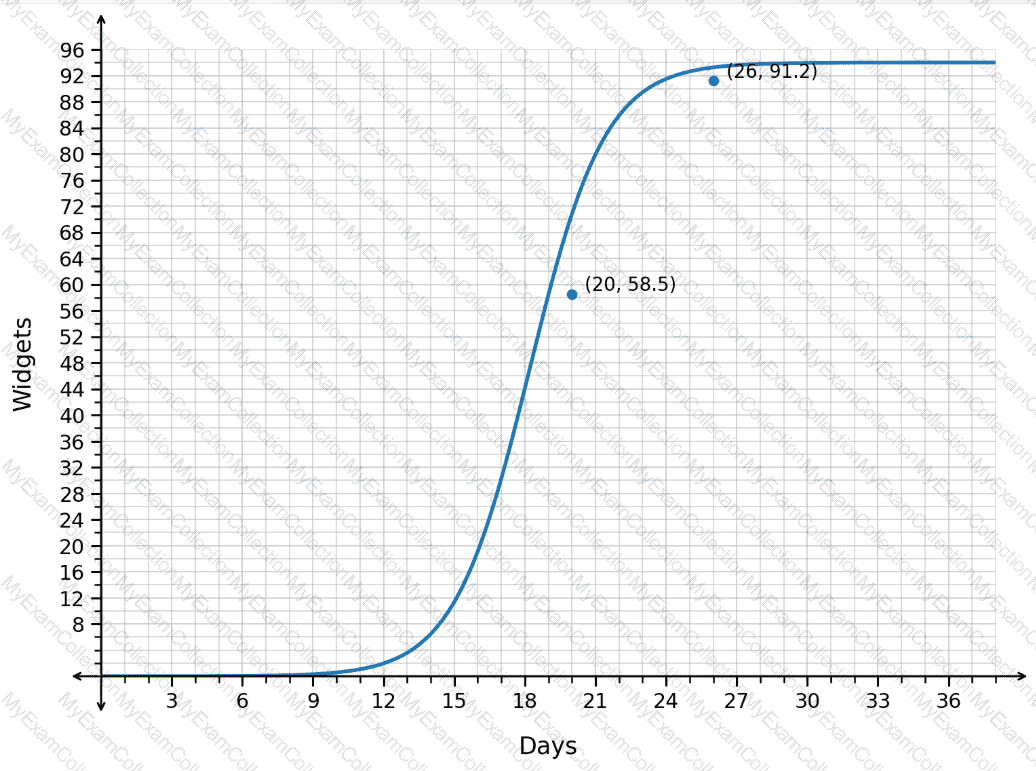
How should the average rate of change from day 20 to day 26 be interpreted?
Question # 11
The temperature of an object changes according to the relationship in the graph.
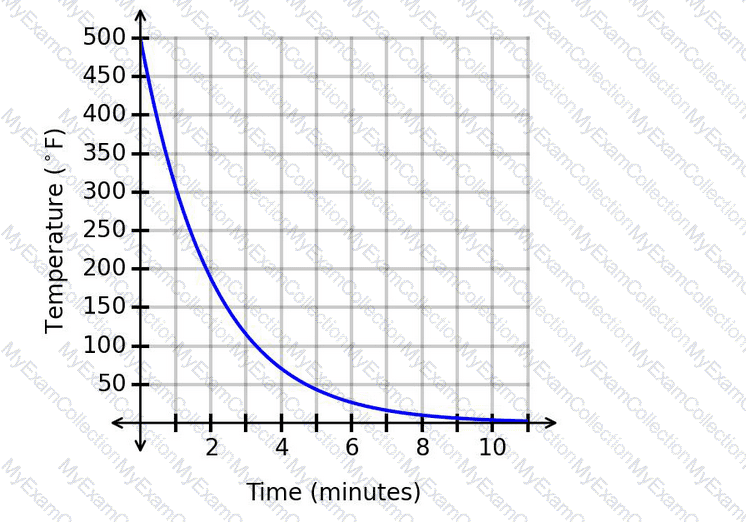
What is the equation of the horizontal asymptote?
Question # 12
After a water tank starts leaking, the amount of water in the tank is modeled by the exponential function that is graphed.
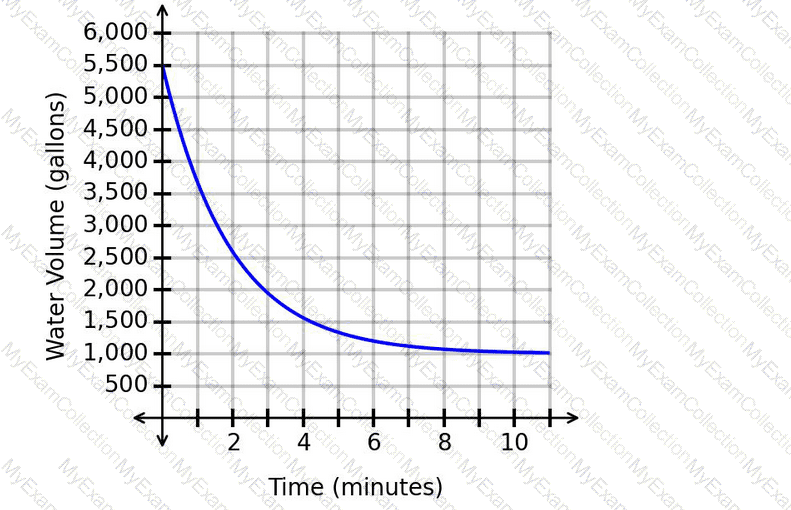
Which statement is justified considering the location of the horizontal asymptote?
Question # 13
The spread of two viruses within a single population is modeled using the functions in the graph.
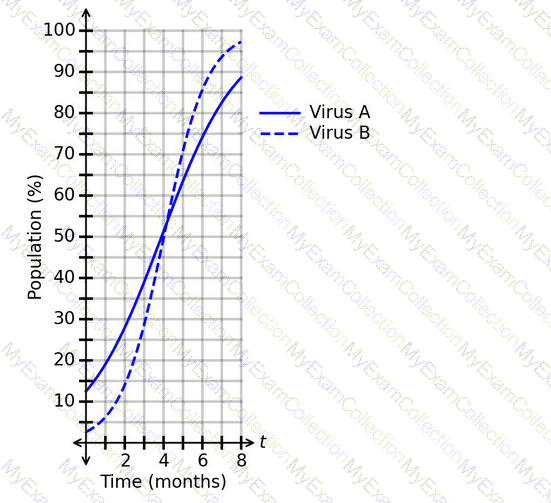
What is a correct conclusion based on the graph?
Question # 14
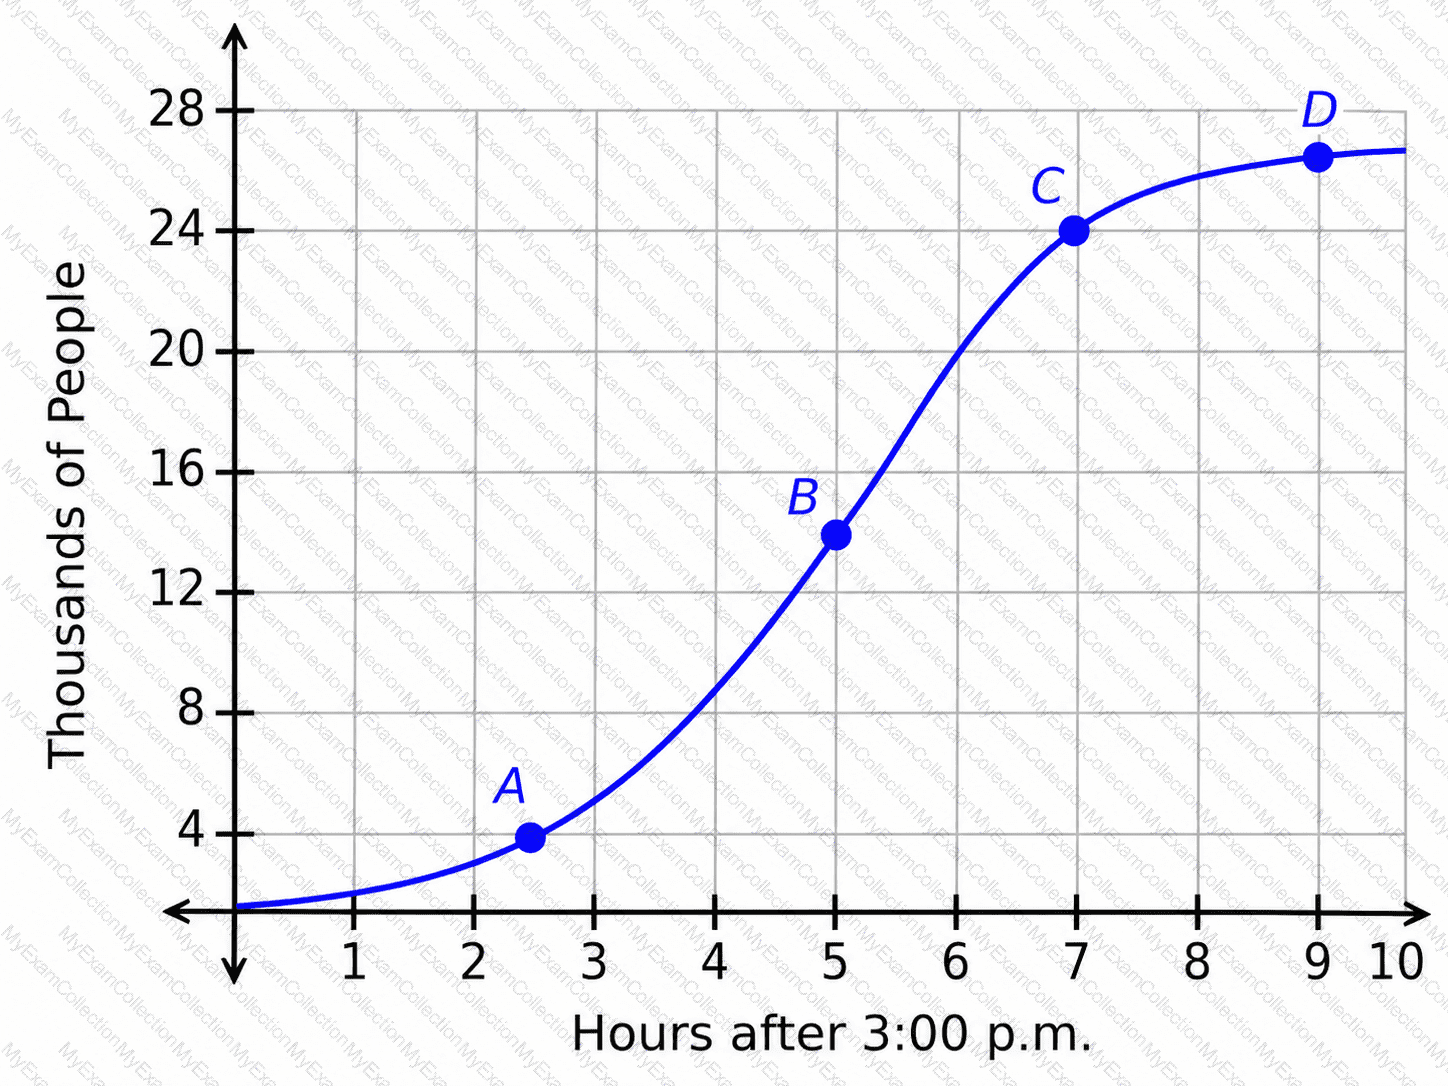
The graph shows the number of people at an event venue after 3:00 p.m., in thousands.
Which rate of change is the greatest?
Question # 15
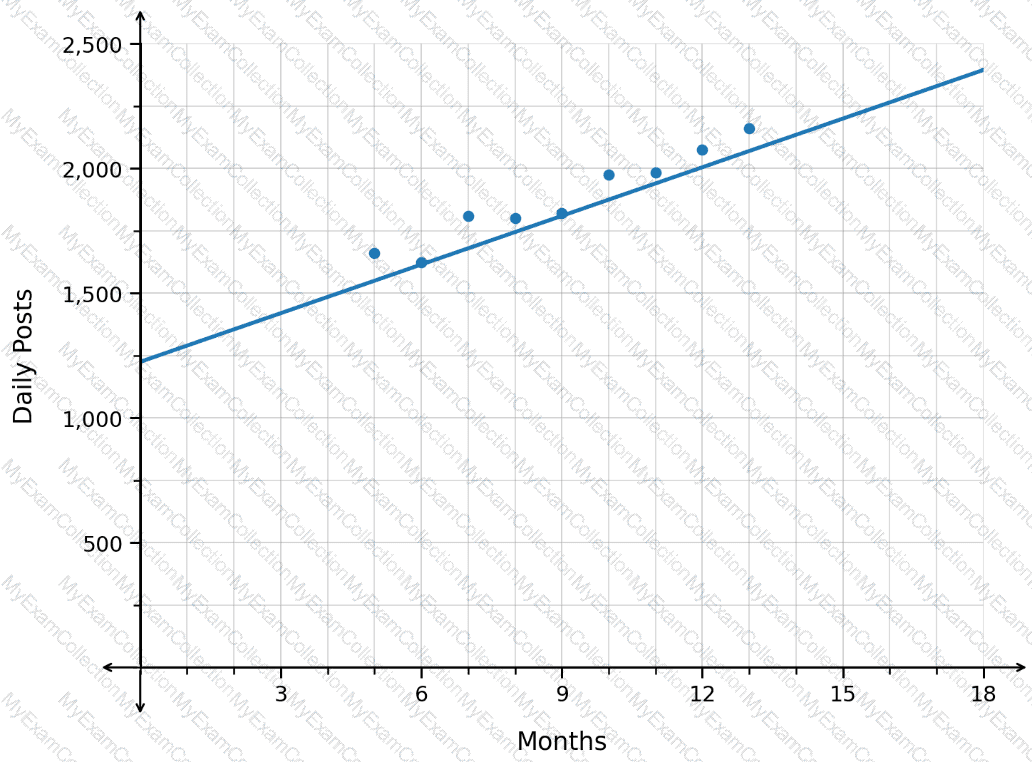
The scatterplot shows data on the usage of a computer ' s CPU over time. The graphed regression function has an r^2value of 0.25.
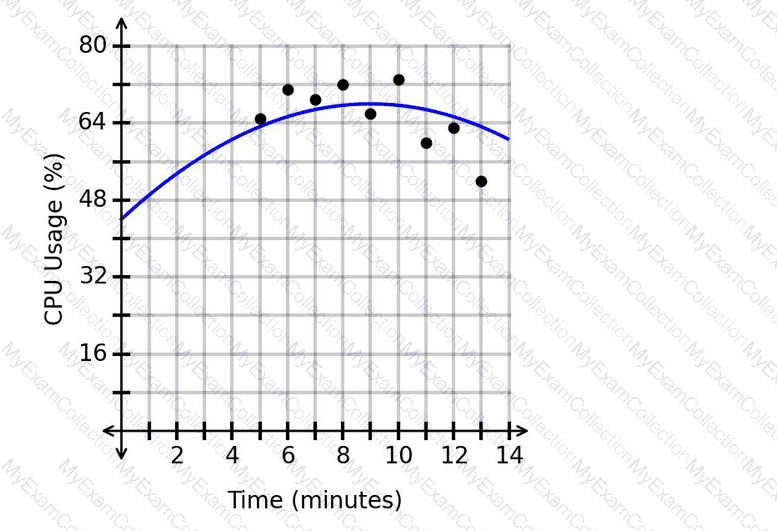
What is the appropriate range of x-values for extrapolation?
Question # 16
The populations, in thousands, of two towns are shown in the graph, where the horizontal axis measures the time in years.
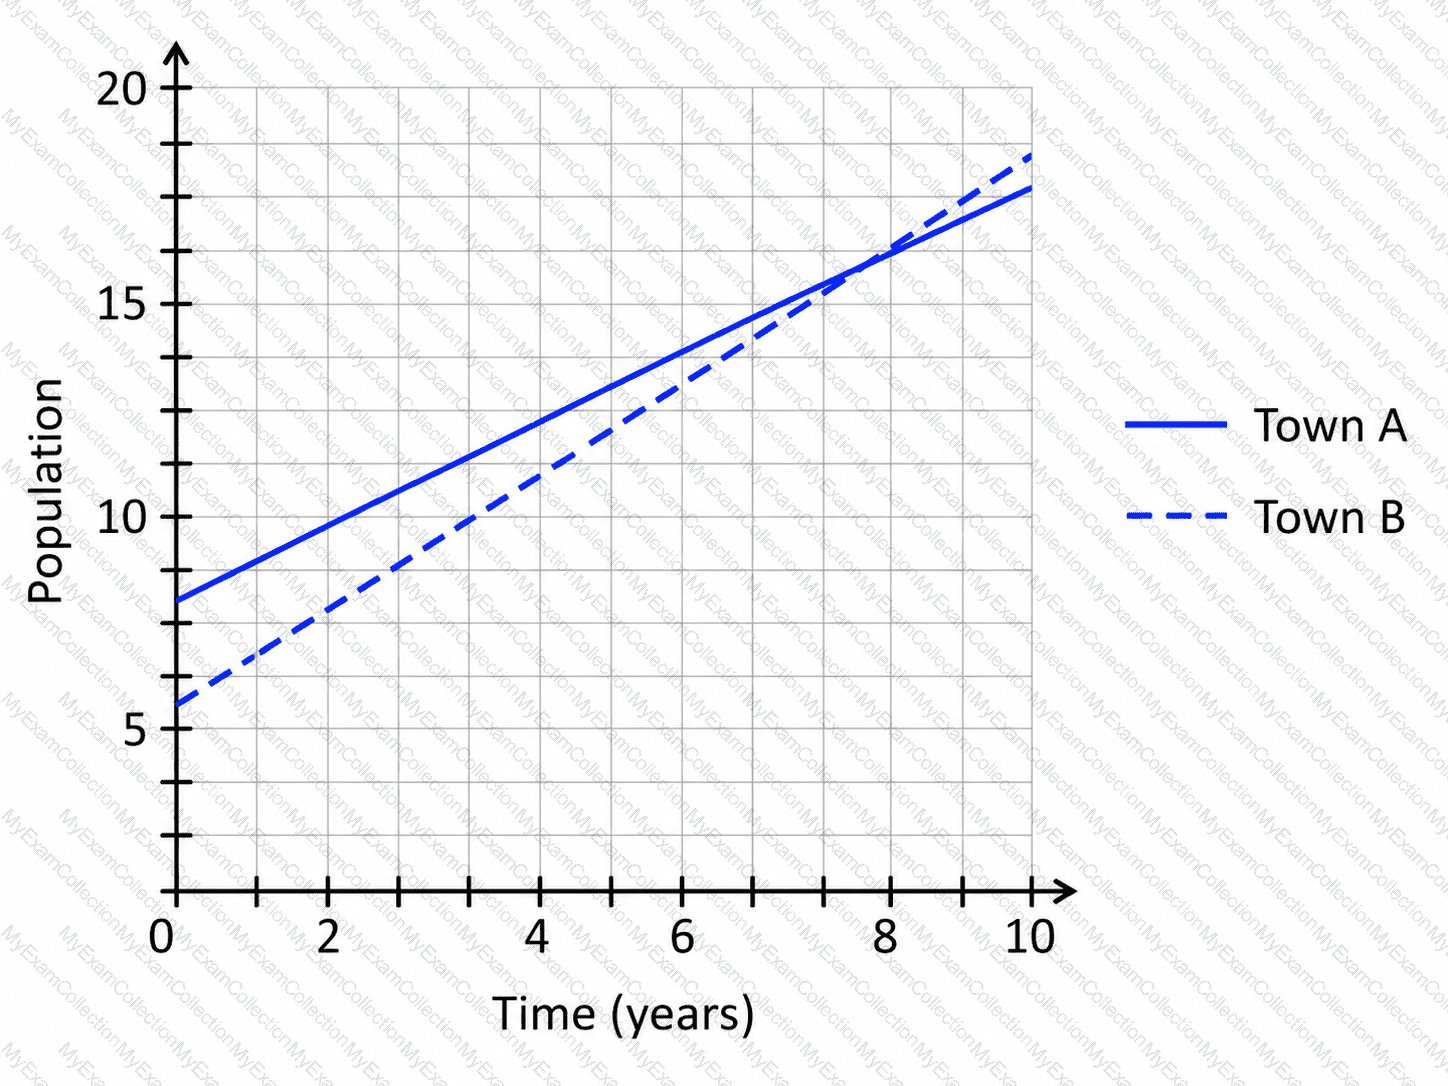
Which town’s population is growing at a faster rate?
Question # 17
The function f(n) represents the relationship between the distances traveled by two vehicles, where n is the distance traveled by vehicle A and f is the distance traveled by vehicle B. The distance traveled by vehicle B is 17 more than the distance traveled by vehicle A.
Which function represents this situation?
Question # 18
The number of people auditioning for a game show is expected to be 7 more than the number of people who auditioned last year. The function A(t) can be used to model the situation, where t represents the number of people who auditioned last year and A(t) represents the number of people expected to audition this year. Which quantity represents the number of people expected to audition this year, given that 440 people auditioned last year?
Question # 19
The populations, in thousands, of two towns are shown in the graph, where the horizontal axis measures the time in years.
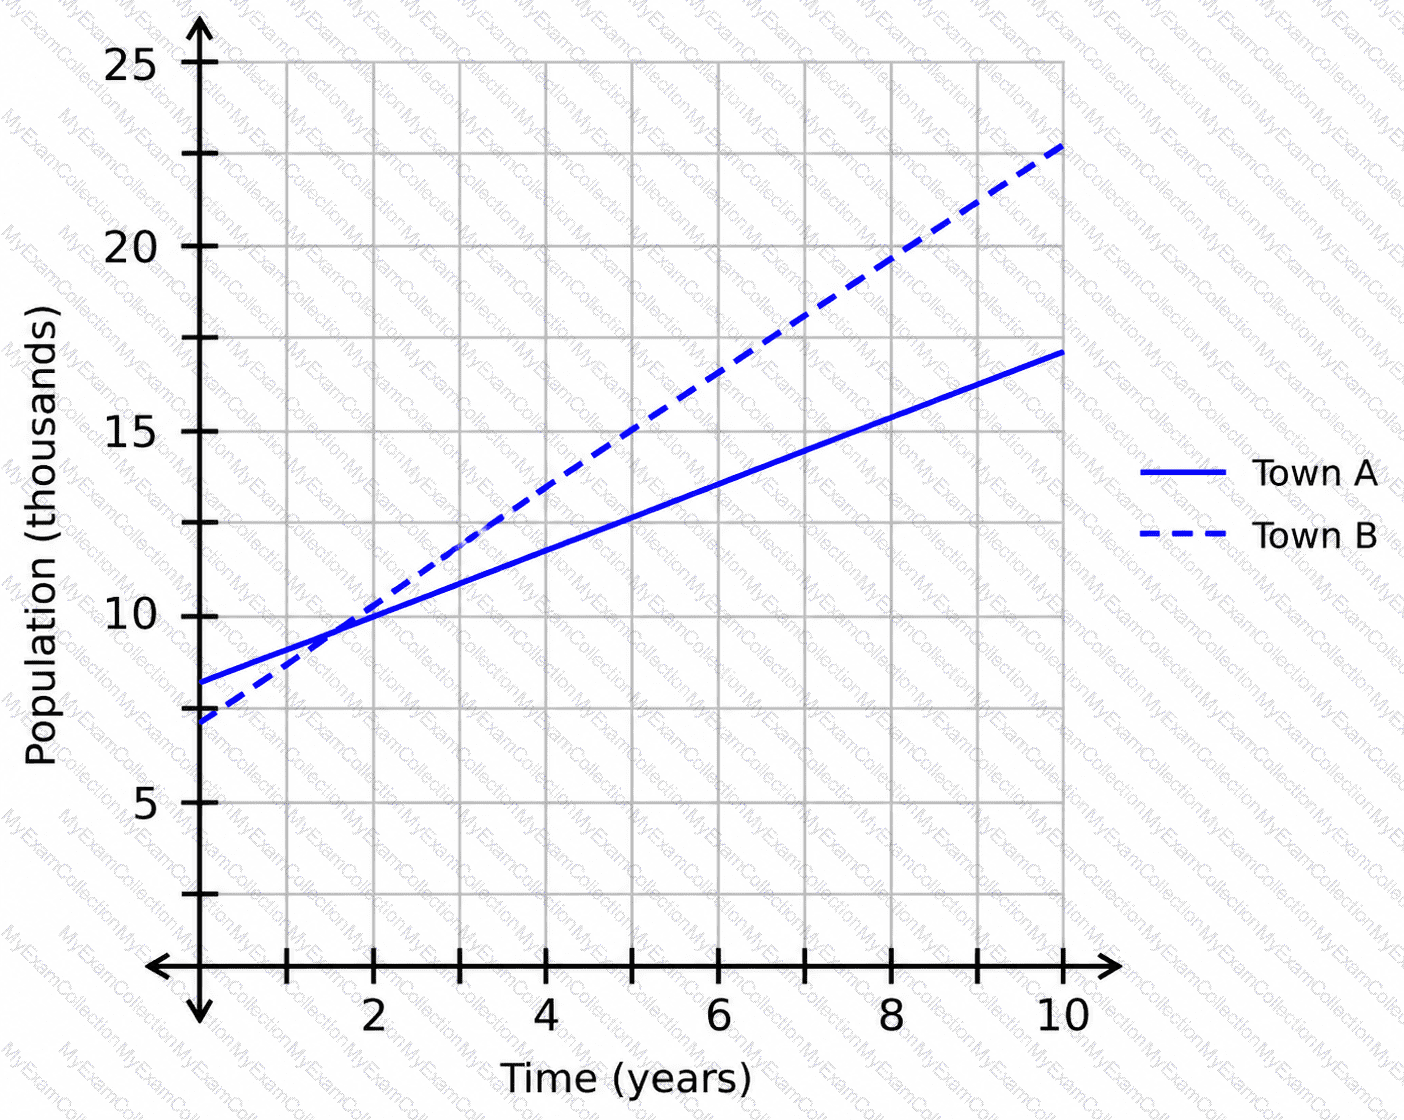
Which town’s population is growing at a faster rate?
Question # 20
The population of fish in a lake is changing according to the function P(t)=31t+438, where t is the number of months since the beginning of the year and P(t) is the fish population at time t. Which interpretation of the rate of change is correct?
Question # 21
The logistic function f(x), whose graph is shown, models the number of registrants for an academic conference, where x represents the number of weeks since registration opened and f(x) represents the number of registrants.
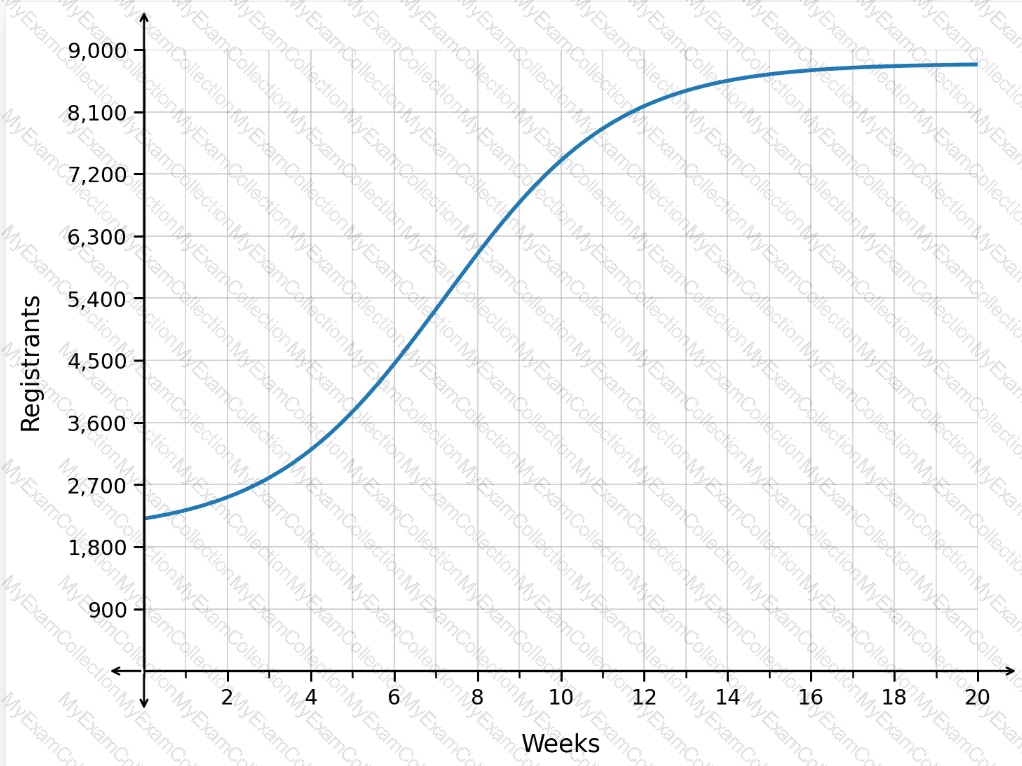
How does the number of registrants change as time progresses from week 1 to week 7?
Question # 22
A cart is being loaded with boxes, and each box has the same weight. After 4 boxes are loaded, the total weight of the boxes and cart is 116 pounds. After 9 boxes are loaded, the total weight is 161 pounds.
What is the weight of each box?
Question # 23
The function F(n) represents the relationship between the number of animals in two enclosures, where n is the number of animals in enclosure A and F is the number of animals in enclosure B. The number of animals in enclosure B is 20 more than the number of animals in enclosure A.
Which function represents this situation?
Question # 24
The number of tasks completed by computer B is 12 more than the number of tasks completed by computer A. Let F(x)represent the relationship between the number of tasks completed by the two computers, where xis the number of tasks completed by computer A and Fis the number of tasks completed by computer B.
Which function represents this situation?
Question # 25
The function
c(t)=-0.01t^4+0.25t^3-2.33t^2+9.02t+8
represents the number of active shopping carts, c, on a website thours after 8:00 a.m.
What is the difference between c(6)and c(8)?
Question # 26
The figure displays the graphs of two functions representing the heights, h_1and h_2, in feet, of two balls tseconds after being launched.
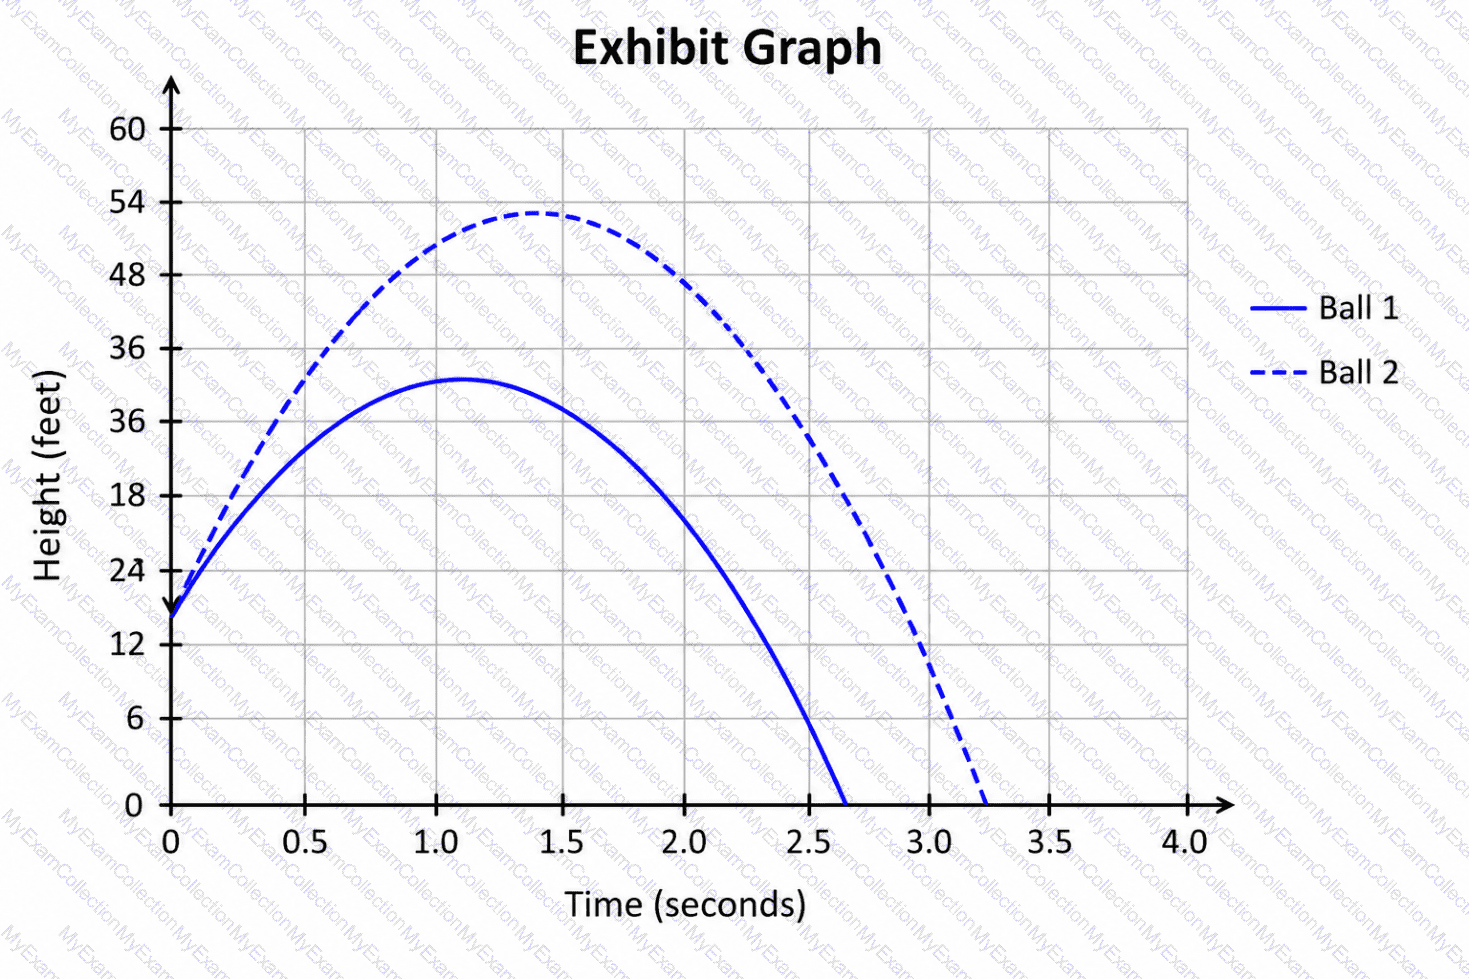
Which ball was lower 0.9seconds after being launched?
Question # 27
The growth of an animal population is shown in the graph. The instantaneous rate of change at point Pis 3.74.
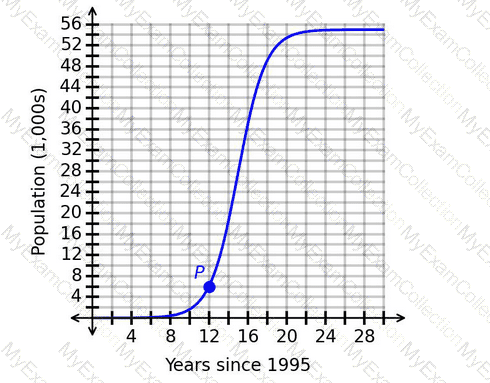
Which interpretation of the instantaneous rate of change is correct?
Question # 28
The graph shows the estimated wait time, in minutes, based on the number of hours after 7:00 a.m.
What is the average rate of change of the wait time from point Ato point B?
Question # 29
The logistic function f(x), whose graph is shown, models the number of people who have created a website account, where xrepresents the number of days since the website started and f(x)represents the number of people who have created an account.
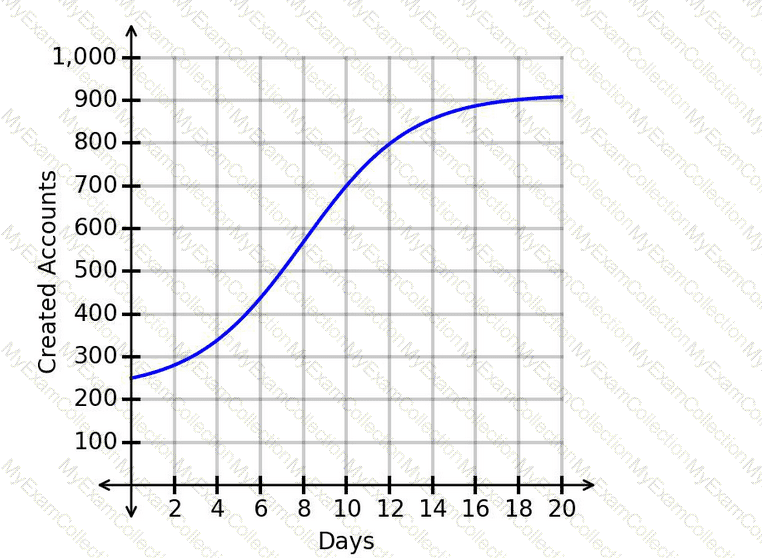
What is one range of values for which the graph is concave down?
Question # 30
The function V(t)represents the number of travelers, V, in a travel depot thours after 7:00 a.m. The graph of V(t)is shown.
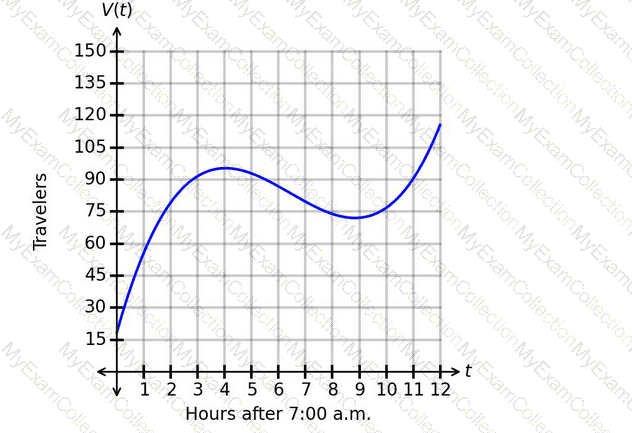
What does V(2)represent?
Question # 31
The scatterplot shows data on the number of shirts sold at a gift shop per week over time. The graphed regression function has an r
2
value of 0.09.
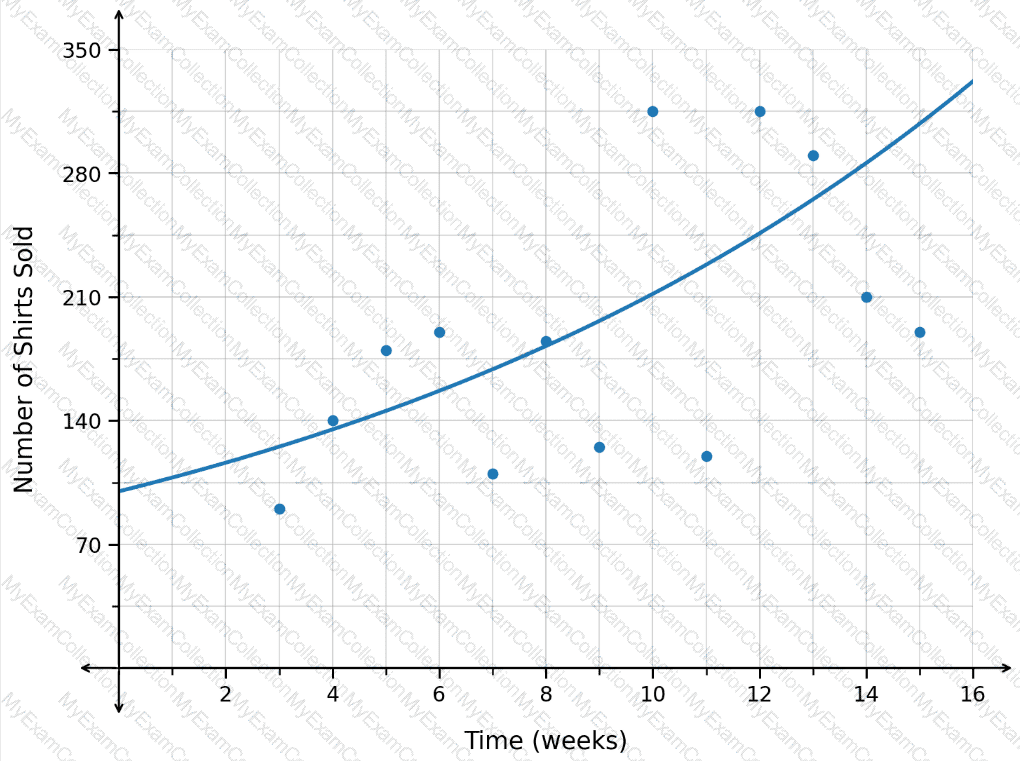
Which range of x-values is appropriate for extrapolation?
Question # 32
The exponential function
f(t)=2900(1.13)
t
represents the size of a bacteria population, where t is the time in hours.
How many bacteria are in the population when t=18?
Question # 33
The number of letters processed daily at a mail center is modeled by the decreasing exponential function shown in the graph.
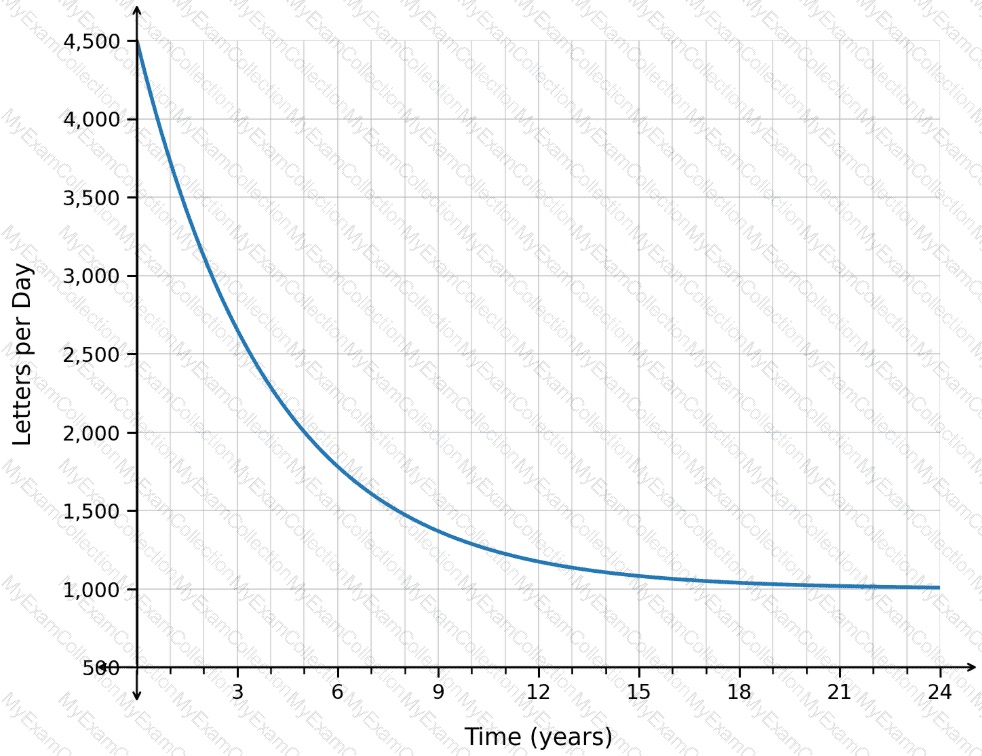
What is the long-term trend in the number of letters processed per day, based on the equation of the horizontal asymptote?
Question # 34
Consider the graph of x(t) shown. The function represents the number of users, x, watching a live video t hours after 9:00 a.m.
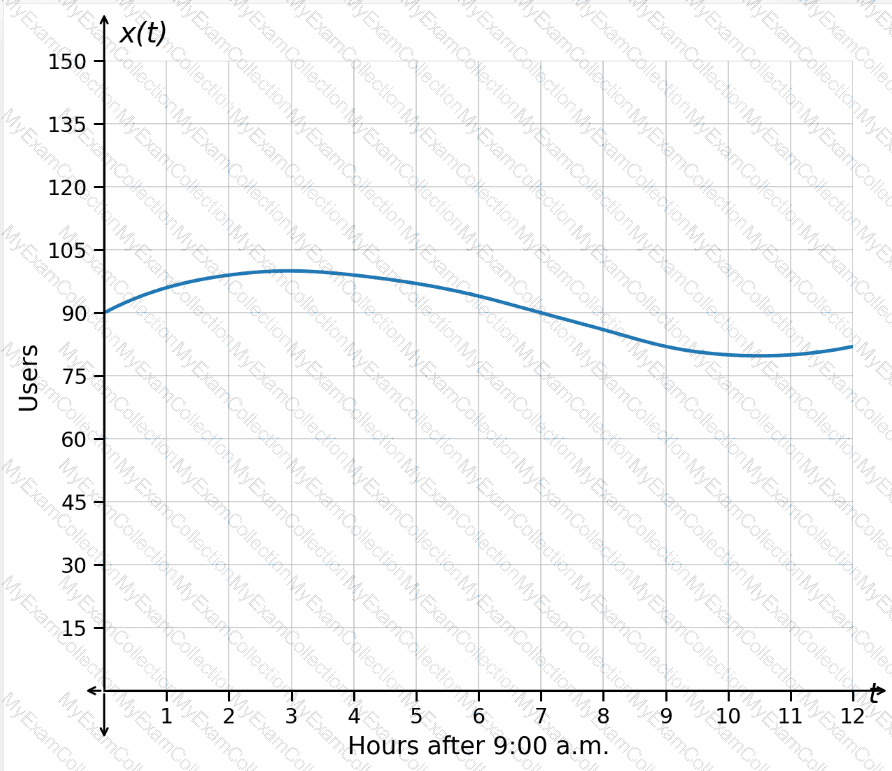
Which interval represents a range of values for which the number of users is decreasing slower and slower?
Question # 35
The graph shows the number of user accounts on a social media website over time.
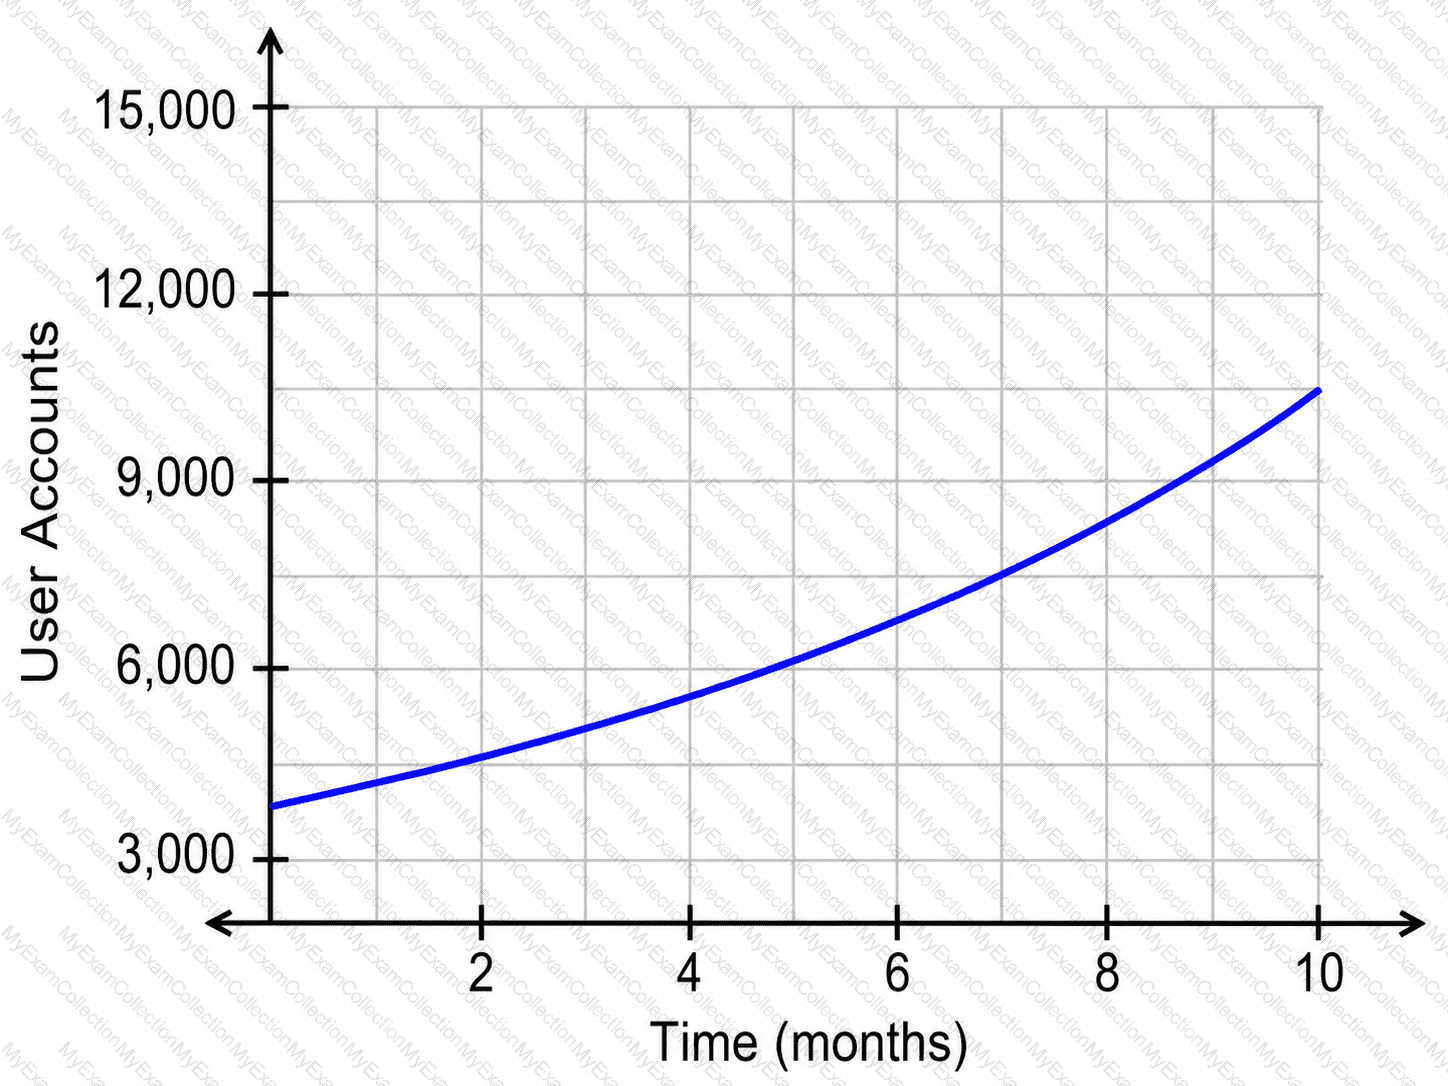
When did the number of user accounts reach 4,500?
Question # 36
The scatterplot shows data on the population of rabbits in a nature preserve. The graphed regression function has an r^2value of 0.94.
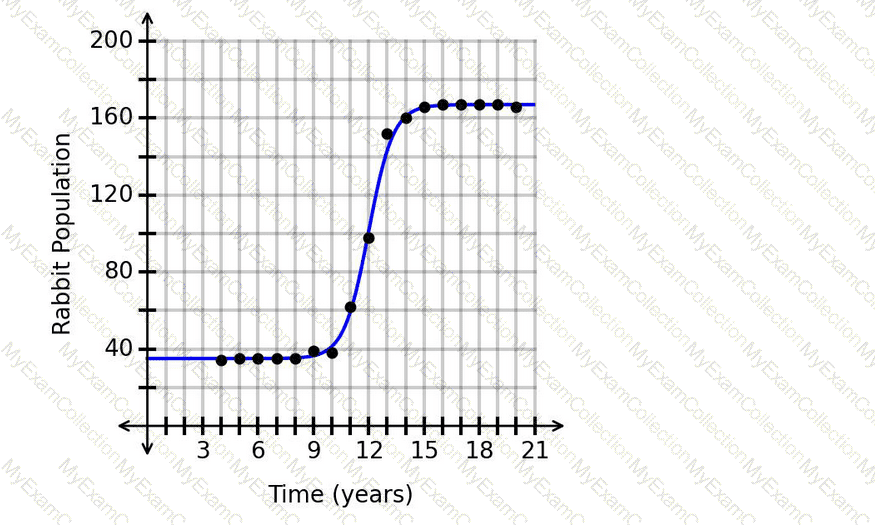
What is the appropriate range of x-values for extrapolation?
Question # 37
A researcher collected data on the average selling price for tickets to a concert over time. The results are shown in the scatterplot. A regression function is graphed with r
2
=0.56. The predicted average selling price for tickets after 10.8 days is $167.20.
Is this prediction appropriate?
Question # 38
A researcher collected data on the number of annual bear sightings in a region over time. The results are shown in the scatterplot. A regression function is graphed with r^2=0.42. The predicted number of annual bear sightings after 19.5years is 62.2.
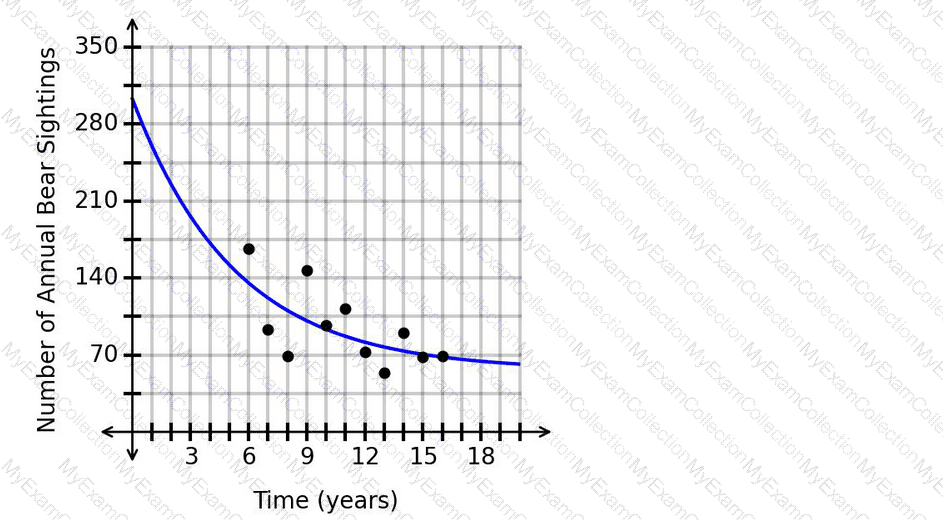
Is this prediction appropriate?
Question # 39
Consider the graph of h(t) shown. The function represents the height, h, in feet, of a ball t seconds after being launched.
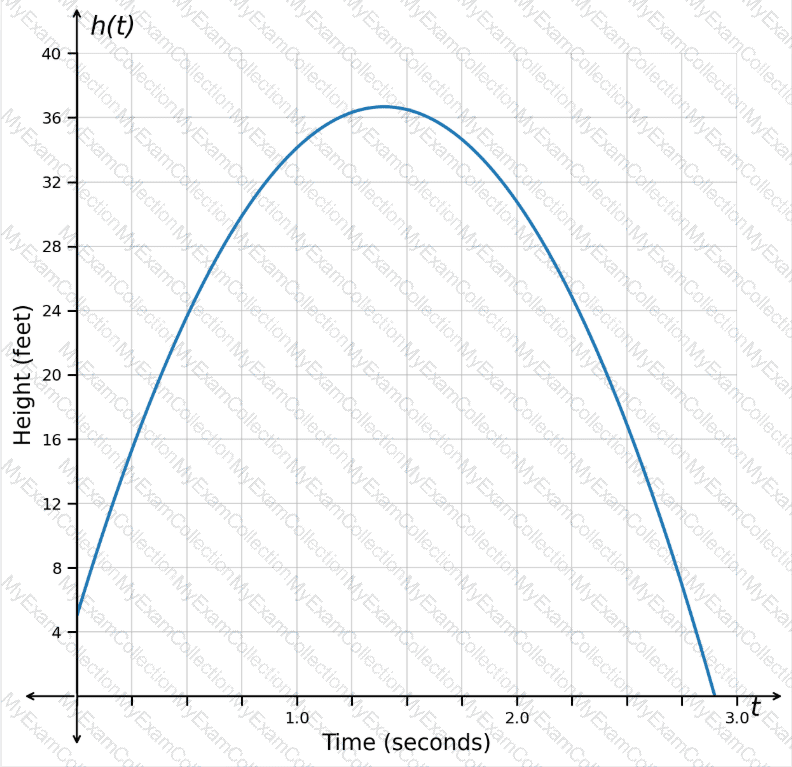
What is the point, if any, at which the concavity changes from concave down to concave up?
Question # 40
The graph shows the number of trees sold by a nursery, where the number of days since the beginning of the month is along the horizontal axis and the number of trees sold per day is along the vertical axis. The greatest number of trees are sold when the temperature is over 70°F.
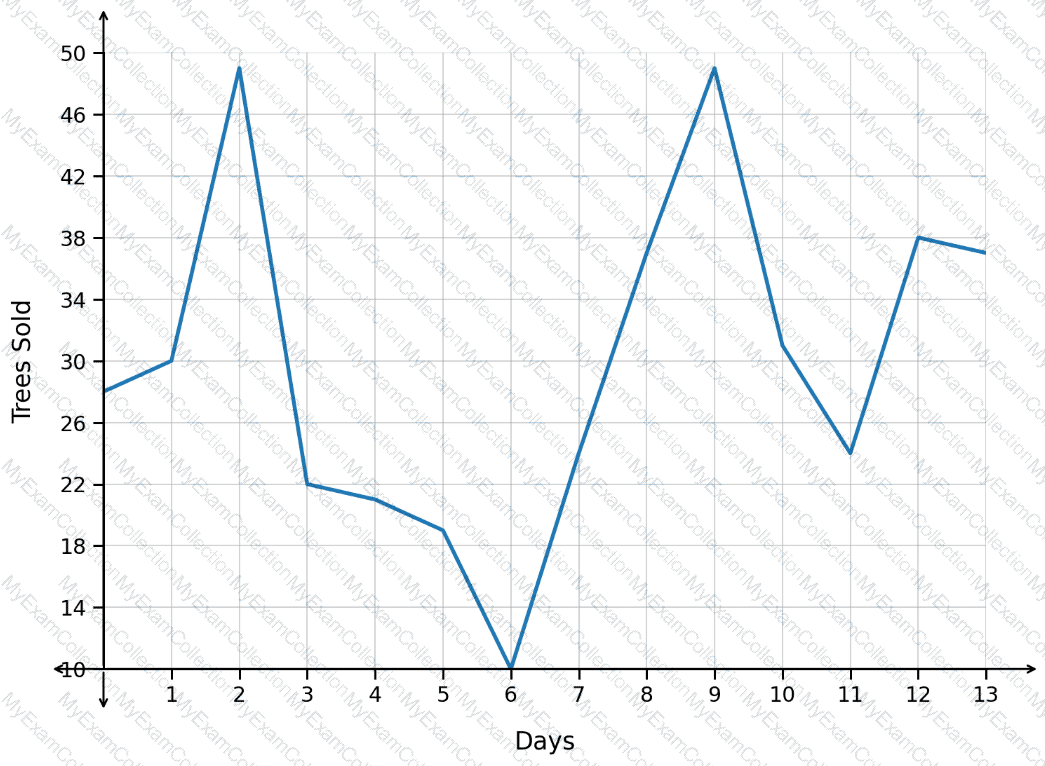
When was the temperature likely over 70°F?
Question # 41
The weight of a radioactive sample is given by the function
W(x)=740× 〖 0.87 〗 ^x
where xis the time, in years, and Wis the weight of the sample, in ounces.
What is the weight of the sample when x=3?
Question # 42
The graph shows the daily practice duration for a musician, where the number of days since the beginning of the month is along the horizontal axis and the number of minutes practiced per day is along the vertical axis.
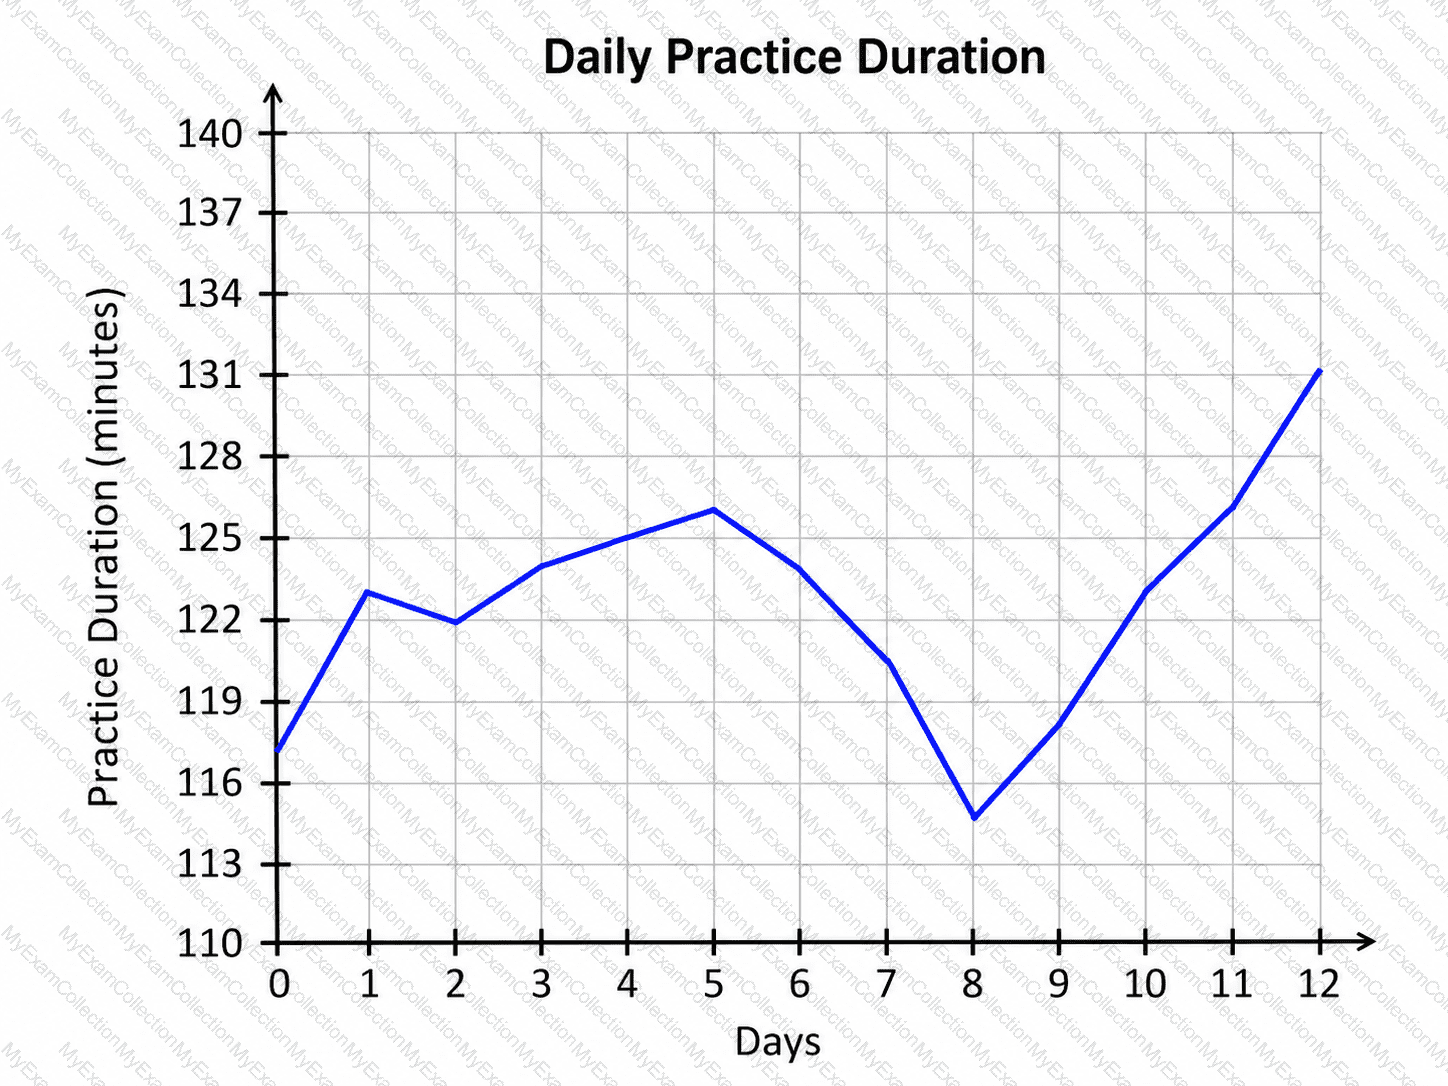
Based on the graph, what was the practice duration for day 8?