Question # 5
Which of the following are interactive elements that can be added to a dashboard for users?
Question # 6
You have a data set that builds a union between two tables. You need to extract the data set. What should you use to extract the data set?
Question # 9
Which aggregation is available without requiring a table calculation or calculated field?
Question # 10
Which of the following represent a valid method to create a Bullet Graph with the LEAST number of fields possible?
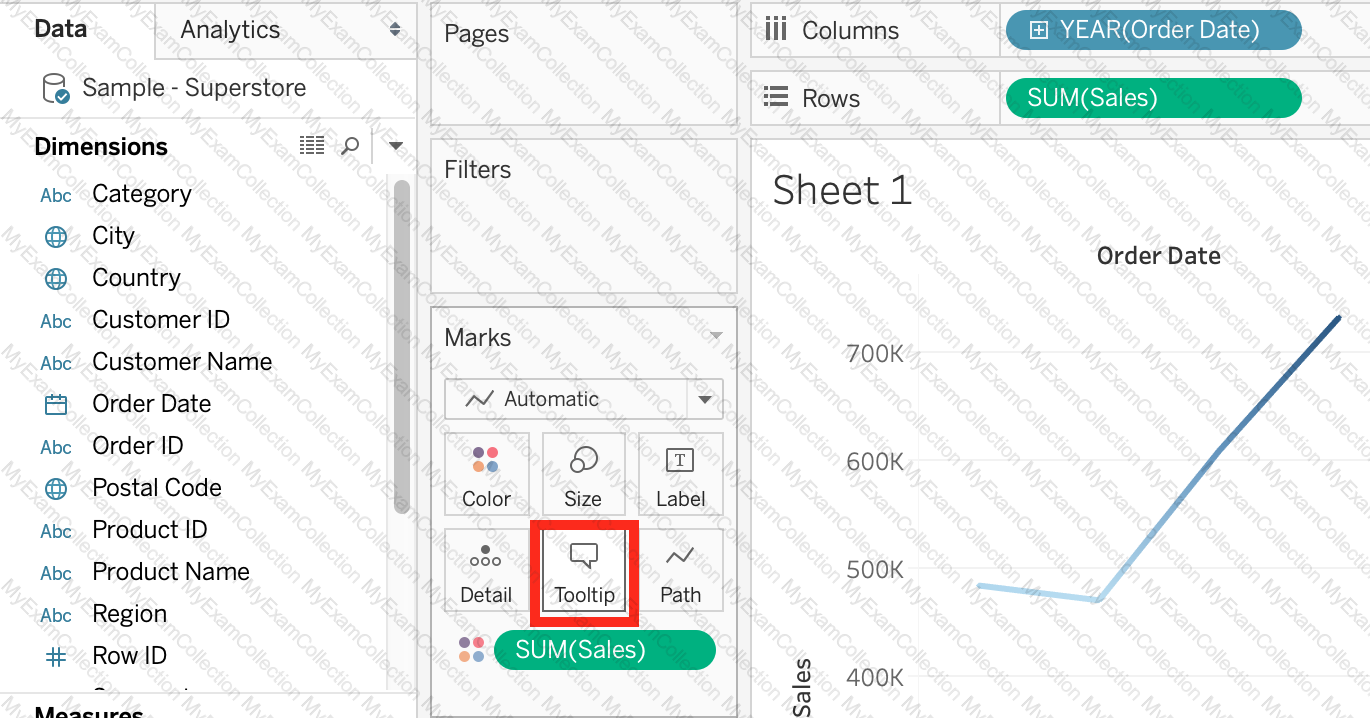
Question # 12
Which of the following are valid ways to Bold the Tooltip content in Tableau?
 Graphical user interface, application
Description automatically generated
Graphical user interface, application
Description automatically generated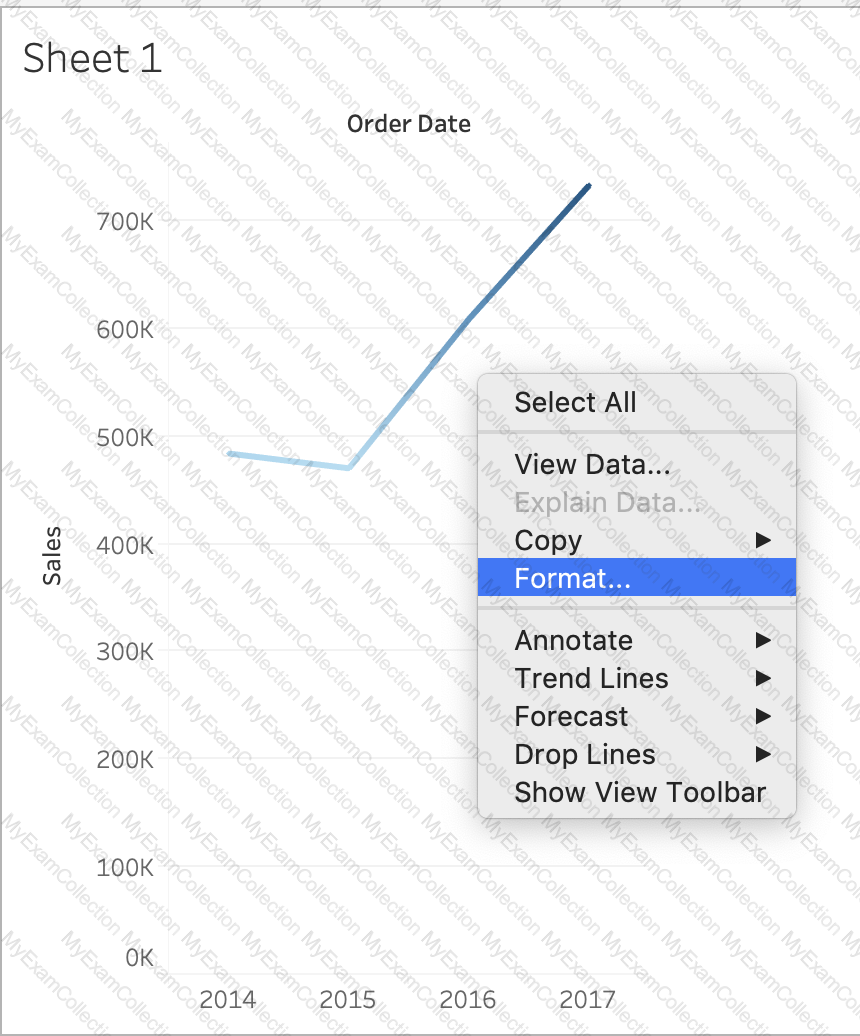 A picture containing line chart
Description automatically generated
A picture containing line chart
Description automatically generated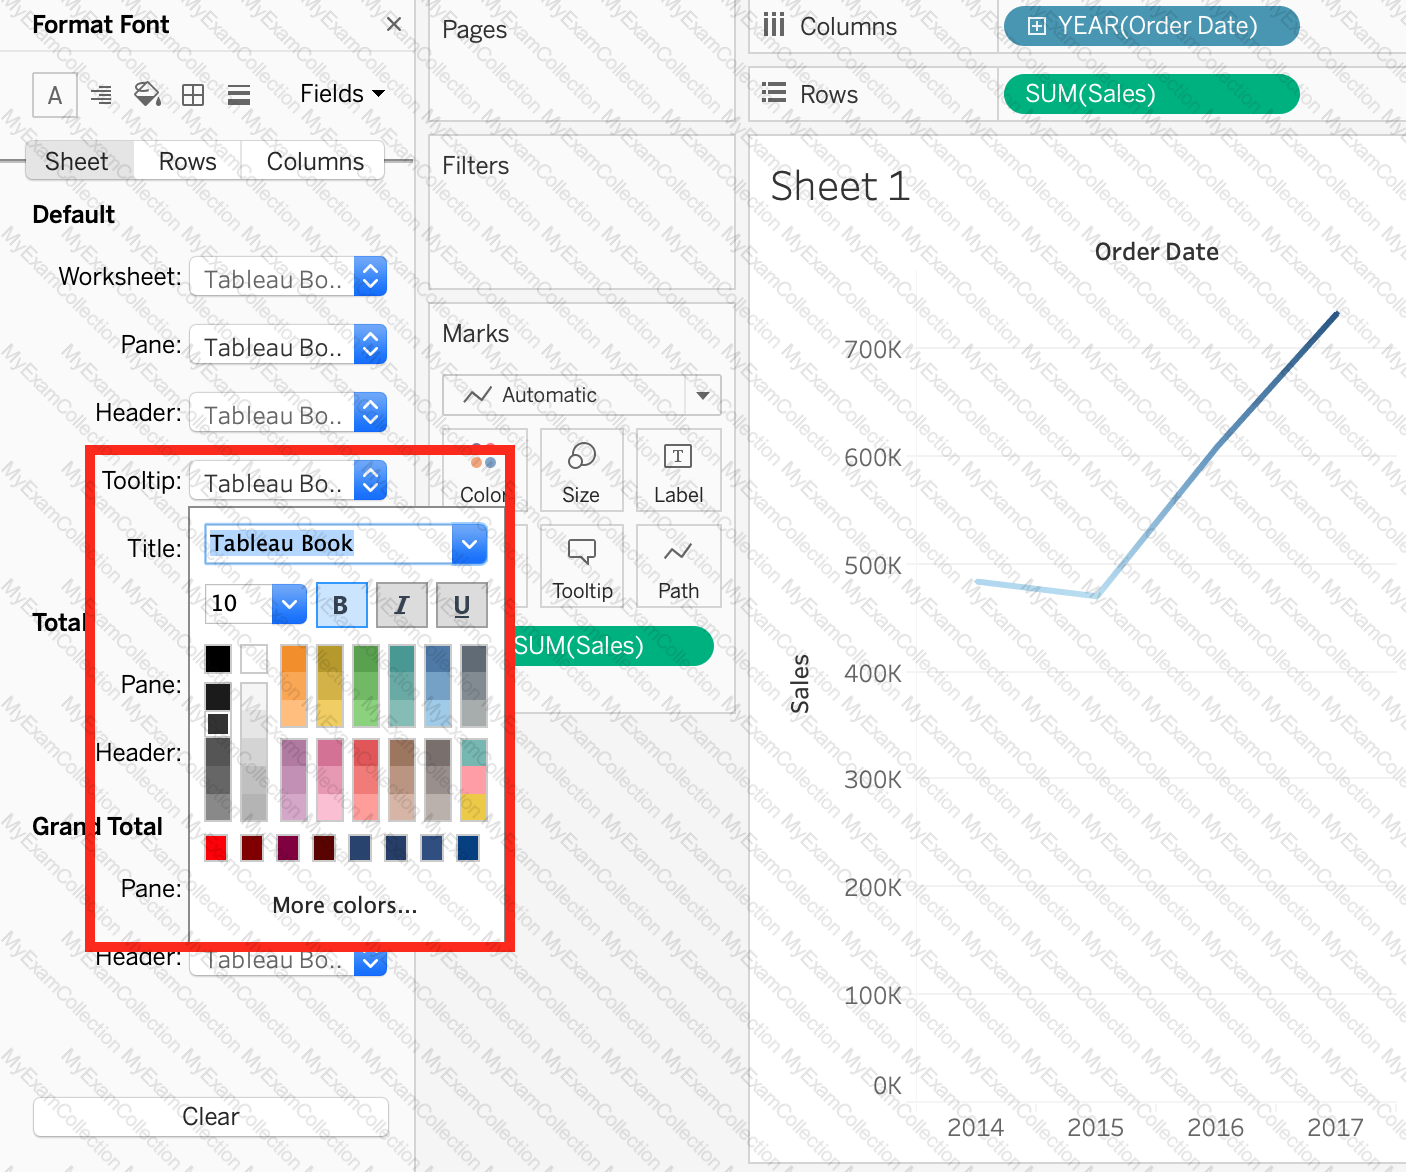 Graphical user interface
Description automatically generated
Graphical user interface
Description automatically generated
Question # 13
What is the one most important thing you should do after creating a Dual-axis chart?
Question # 14
Which of the following are valid objects when creating a dashboard in Tableau? Choose 4.
Question # 15
When exporting a worksheet as an image in Tableau, which of the following file formats are available?
Question # 17
You create a dashboard that tracks your teams progress on various projects. On the dashboard, you want to display your company's web page. Which dashboard element should you use?
Question # 18
You want to save a view as an image that you can paste into a Microsoft Word document. Which two statements accurately describe exporting a view as an image? Choose two.
Question # 20
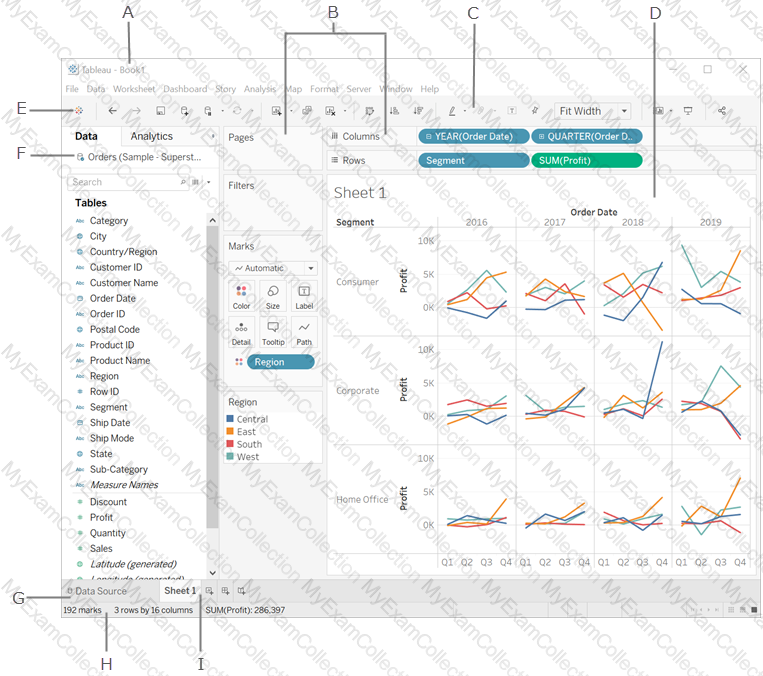
You clicked Sheet 1 from the data source page, and now you have opened the Tableau Desktop workspace as shown above. What is the main thing that you do here?
 Graphical user interface, application
Description automatically generated
Graphical user interface, application
Description automatically generated
Question # 21
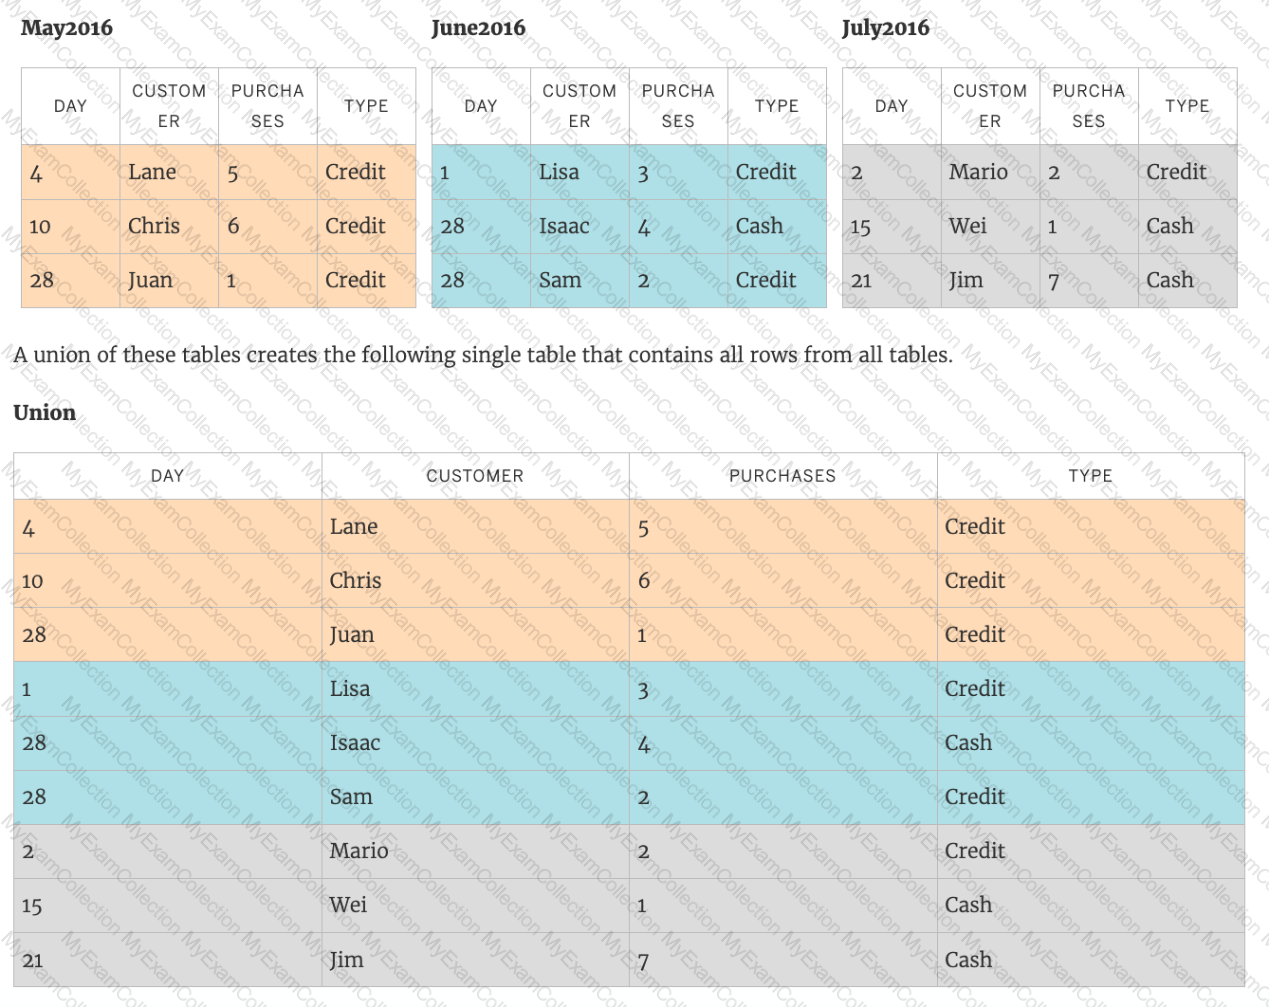
______________ is a method for appending values (rows) to tables. You can use this method if both tables have the same columns. The result is a virtual table that has the same columns but extends vertically by adding rows of data.

Question # 23
What are three geographic roles that you can assign to a field? Choose three.
Question # 24
True or False:Â Physical tables remain distinct (normalized), not merged in the data source whereas logical tables are merged into a single, flat table.
Question # 25
Relationships are represented by __________________ and operate at the ____________________.
Question # 26
What are two use cases for creating hierarchies from the Data pane? Choose two.
Question # 27
You are creating a combined axis chart.
Where should you drag the second measure after dragging the first measure to the Rows shelf?
Question # 28
True or False: We can disaggregate the data, to see all of the marks in the view at the most detailed level of granularity
Question # 29
Using the Time Series table, create a chart that shows the percent difference in Average Inventory on Hand for each Assortment by year and quarter.
How many quarters did the Electronics Assortment show a negative percent difference in the Average Inventory On Hand?
Question # 31
Suppose you create a bar chart by dragging a dimension to the Column shelf and a measure to the Rows shelf. Which of the following would create a stacked bar chart?
Question # 32
Is it possible to deploy a URL action on a dashboard object to open a Web Page within a dashboard rather than opening the system’s web browser?
Question # 33
When using a data source that has relationships, how can you add a join between two or more tables?
Question # 34
Skipped Join the Geo Data and Time Series Table on the Item Number ID column, and display the Store count for every State on a Map. What was the Store count in 2017 for Texas (TX)?
Join the Geo Data and Time Series Table on the Item Number ID column, and display the Store count for every State on a Map. What was the Store count in 2017 for Texas (TX)?
Question # 35
True or False: You get different filtering options for categorical and quantitative data
Question # 37
Which of the following can help us focus on specific data without removing data in the visualization?
Question # 38
What are two benefits of using a live connection to a data source as compared to an extract? Choose two.
Question # 40
You can create _______________ for members in a dimension so that their labels appear differently in the view.
Question # 41
Using the Time Series table, create a cross-tab showing sales for each Assortment broken down by Year and Quarter. In Q4 of October 2017, what was the Average sales amount for the Hardware assortment?
Question # 43
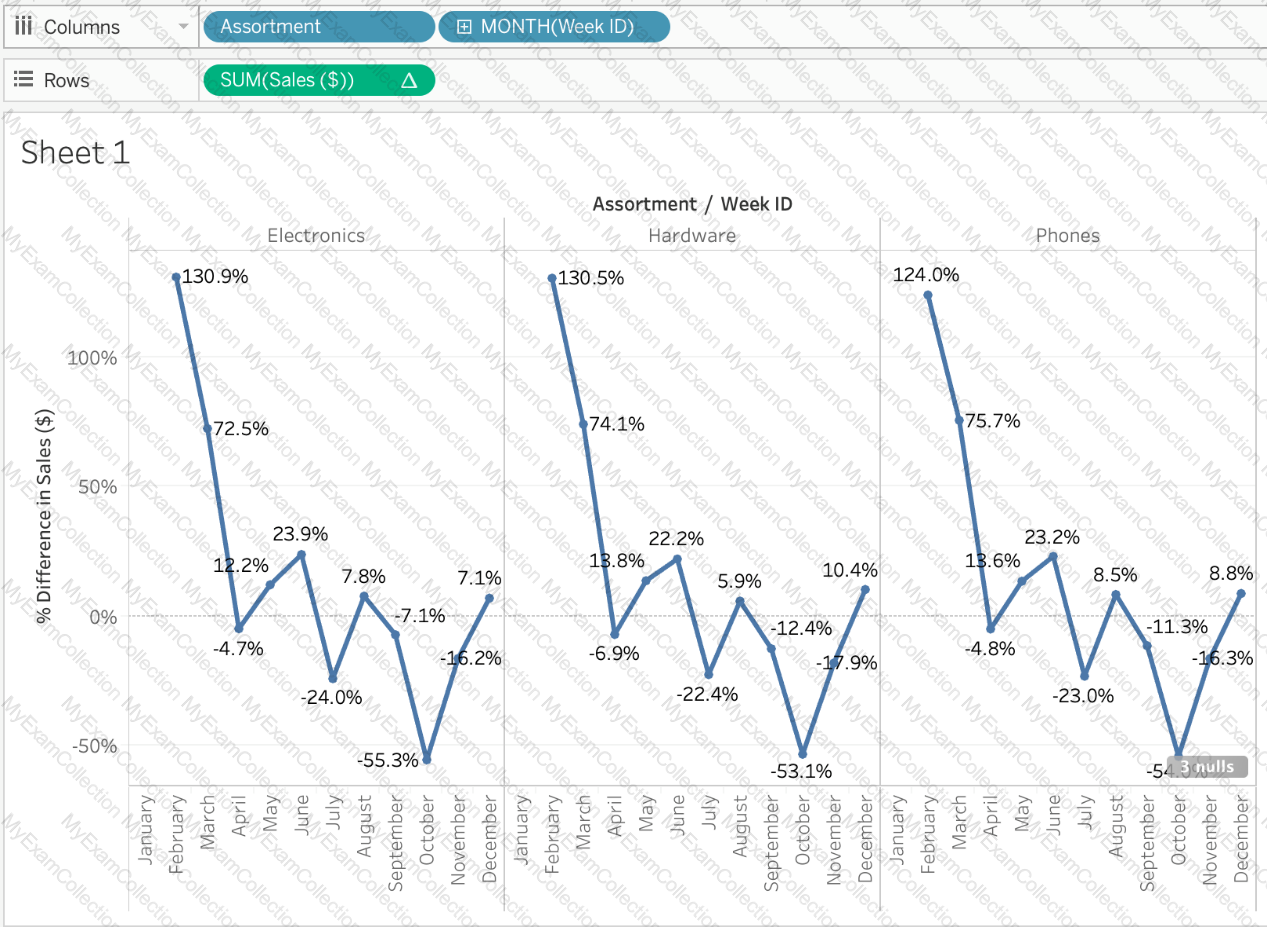
Using the Time Series Table, create a Line chart showing the Monthly Year over Year Growth for the Sales, broken down by Assortment. For the Electronics assortment, which Month had the most NEGATIVE value of Year over Year Growth?
Using the Time Series Table, create a Line chart showing the Monthly Year over Year Growth for the Sales, broken down by Assortment. For the Electronics assortment, which Month had the most NEGATIVE value of Year over Year Growth?
Question # 44
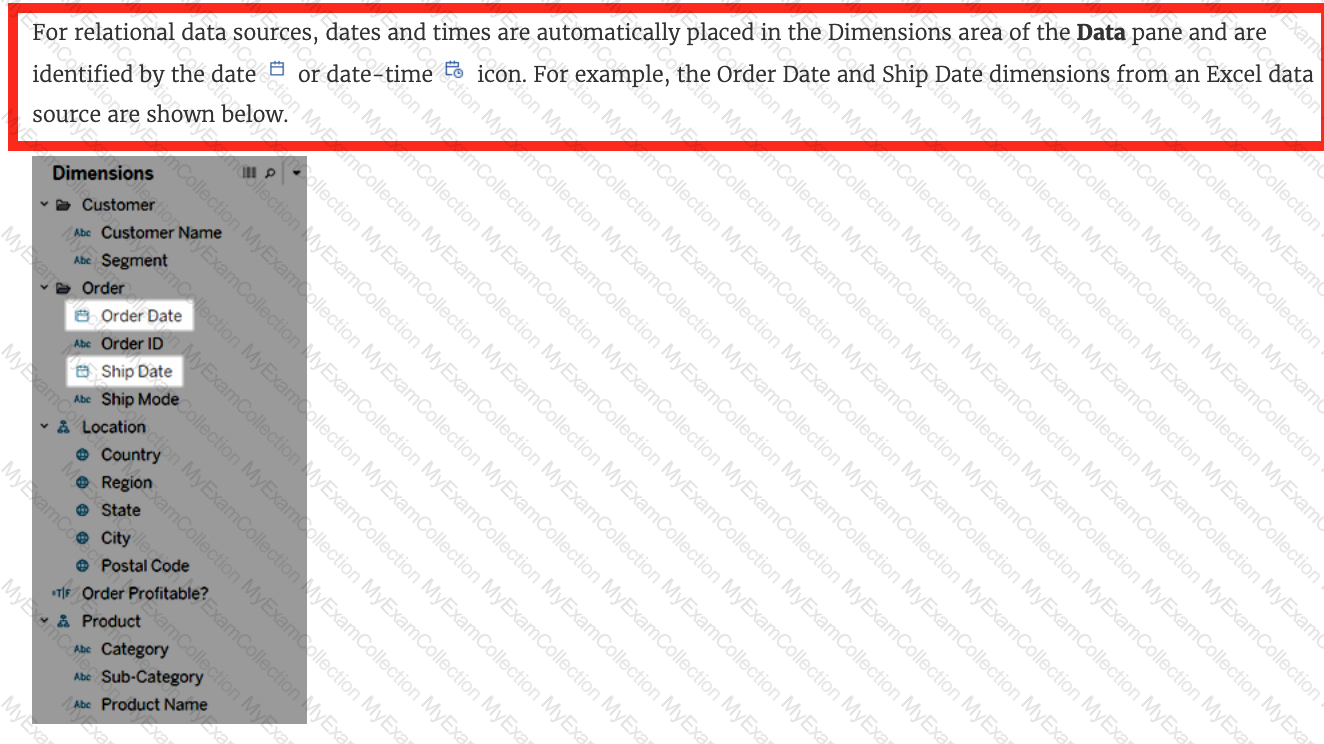
Broadly speaking, after an importing a dataset in Tableau Desktop, all fields in it are broken down into _______________________
Question # 45
What are two use cases for creating hierarchies from the Data pane? Choose two.
Question # 46
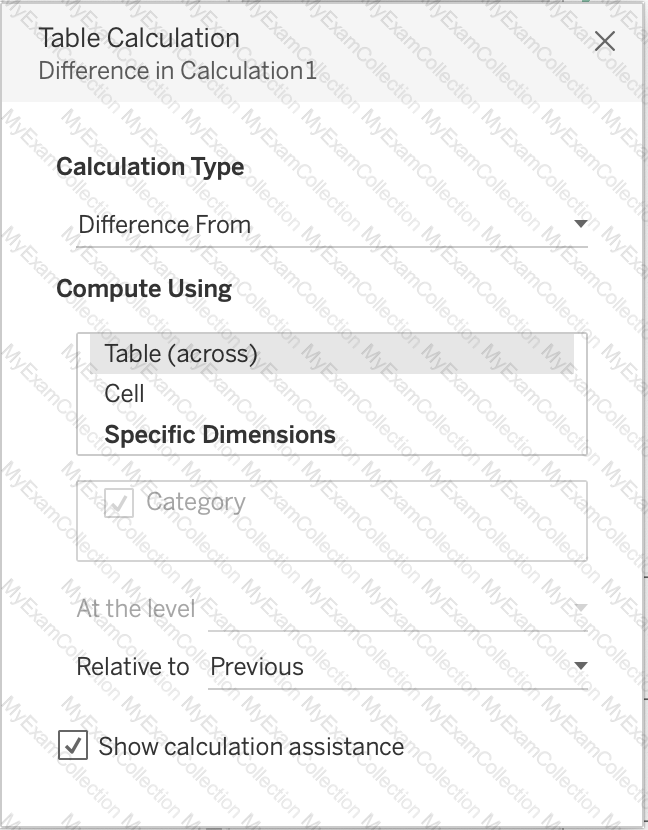
Which of the following calculations DO NOT need a quick table calculation?
Question # 48
Which type of date filter can you use to choose a range of dates based on TODAY ()?
Question # 49
Which two actions can you perform when you join tables from multiple connections? Choose two.
Question # 51
Which of the following lets you group related dashboard items together so you can quickly position them?
Question # 52
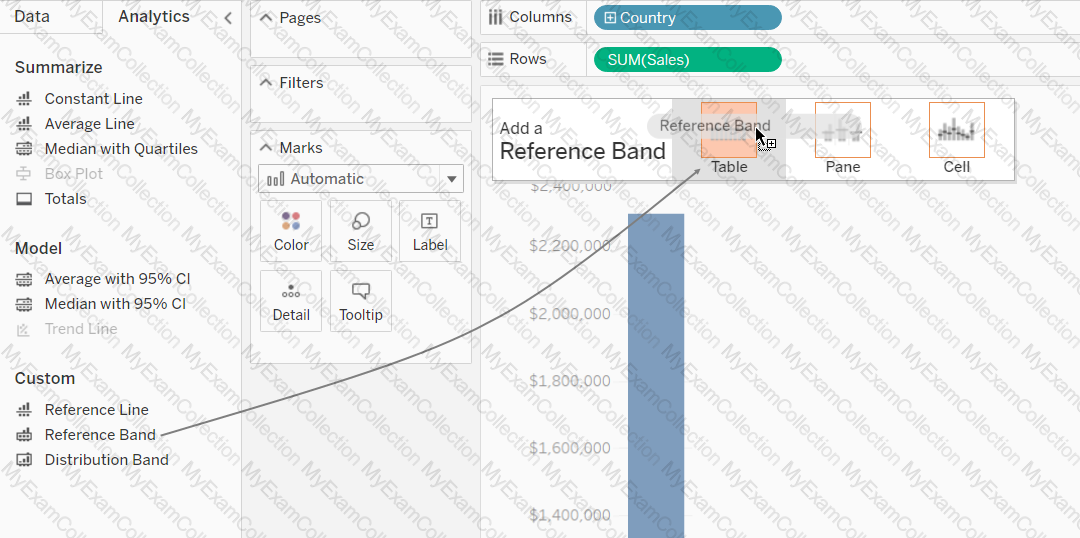
What statement correctly describes a requirement to create a reference line in Tableau?
Question # 55
What two methods can you use to change the font of a worksheet title? Choose two.
Question # 57
Which of the following situations describe the best reason to use a union?
Question # 60
Which of the following are valid ways to export a dashboard with multiple visualisations as an image?
Question # 61
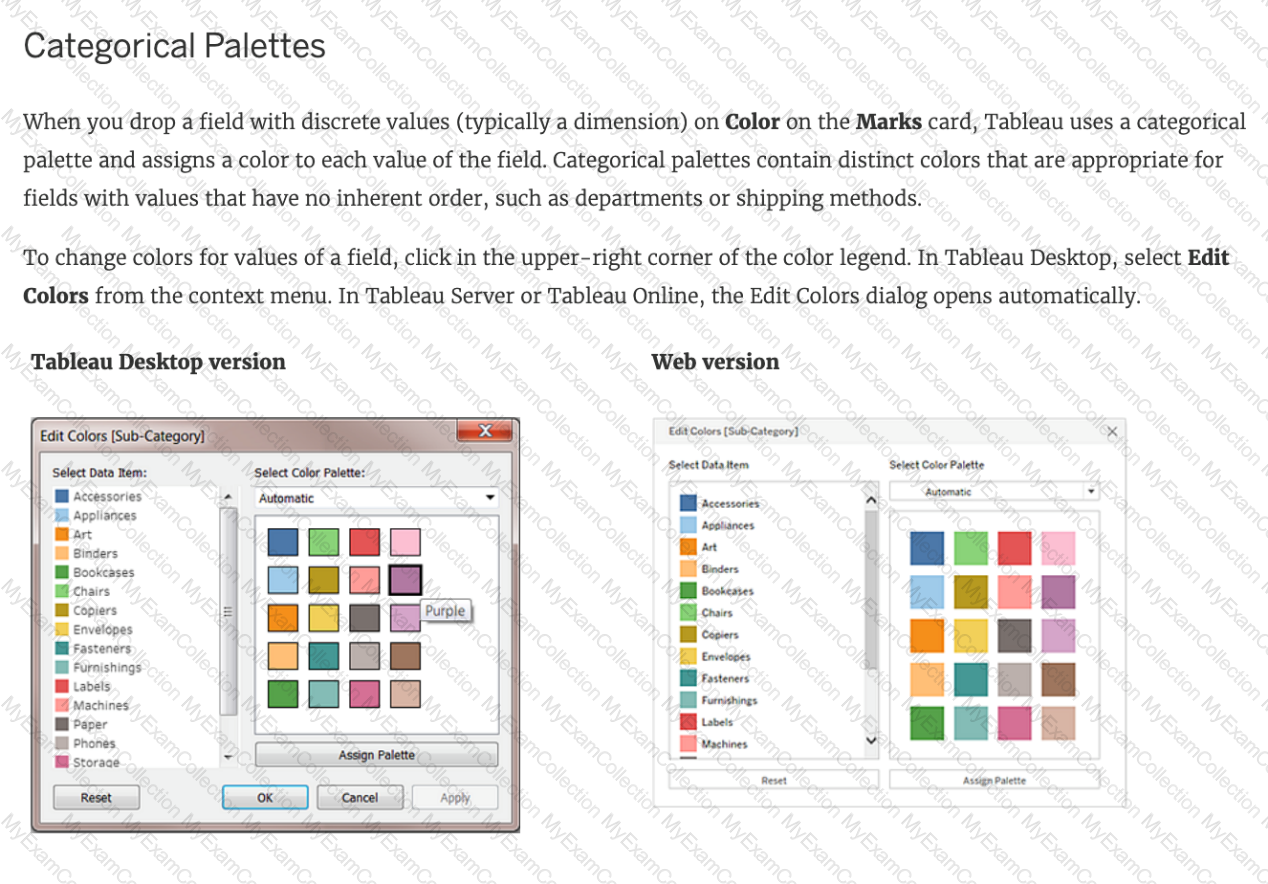
Dragging a ______________ to colour creates distinct colours for each item whereas dragging a ______________ to colour creates a gradient
Question # 62
While borders and background colors let you visually highlight items on a dashboard, _________ lets you precisely space items.
Question # 63
Which two analytics options are available for a scatter plot view? Choose two.
Question # 64
Tableau will automatically create a hierarchy for which two kinds of data? Choose two.
Question # 66
We can use ______________ as a static tool to open and interact with packaged workbooks with extracted data sources that have been created in Tableau Desktop.
Question # 67
Which of the following is NOT a valid official data source in Tableau Desktop?
Question # 68
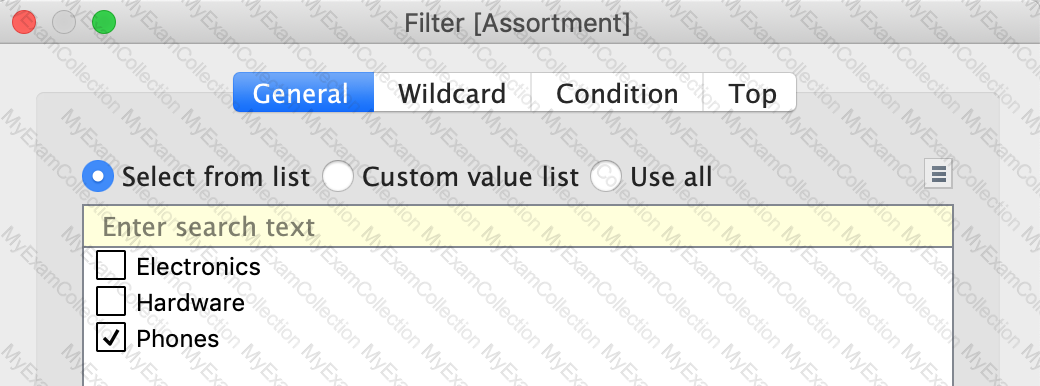
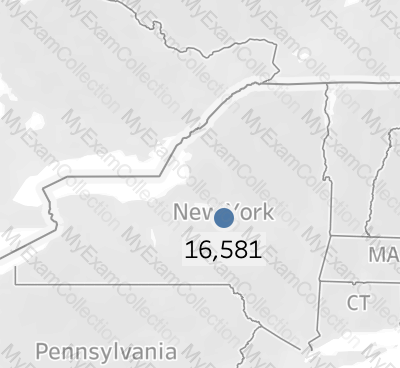
Using the Geo Data Table, create a Map showing Sales made per State. For the State of New York (NY), what was the amount in Sales ($) made for Phone Assortments with White color?
Question # 70
Which of the following are valid ways to show Mark Labels in the visualisation?
Question # 71
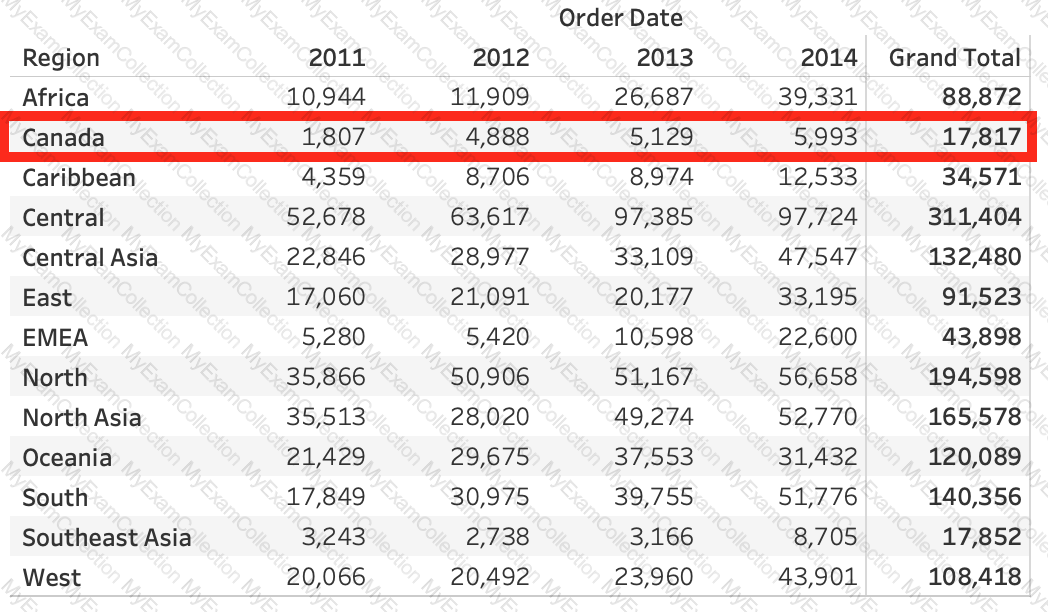
Using the dataset provided, create a crosstab showing the Profit of each Region per Year, then add grand totals to the view. What was the total Profit for Canada in 2012 and the total Profit for Canada for 2011 through 2014, respectively?
Question # 72
To display data that has both negative and positive quantitative values, Tableau Desktop will display marks by using__________________as the default.

Question # 77
Which of the following are correct ways to define a join in Tableau version 2020.3 and above?
Question # 78
Using the dataset, create a bar chart showing the average Quantity broken down by Region, and filtered by Country to only show Japan. What was the average Quantity in the State of Tokyo?
Question # 80
Beginning in version 10.5, when you create a new extract, it uses the _________ format instead of the .tde format.
Question # 81
If you are working with a huge dataset, which of the following are strong reasons to use a context filter?
Question # 85
True or False: It is not possible to blend axes for multiple measures into a single axis
Question # 86
You have the following visualization.
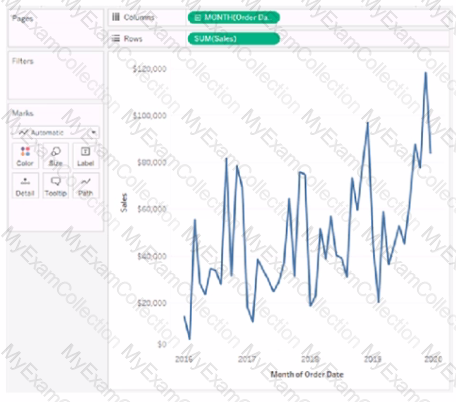
Where should you place a field named Region to show multiple distinct lines on the same axis?
Question # 87
How can you MANUALLY assign geographic roles to a dimension from the data pane?
Question # 88
What are two requirements to combine two tables by using a union? Choose two.
Question # 91
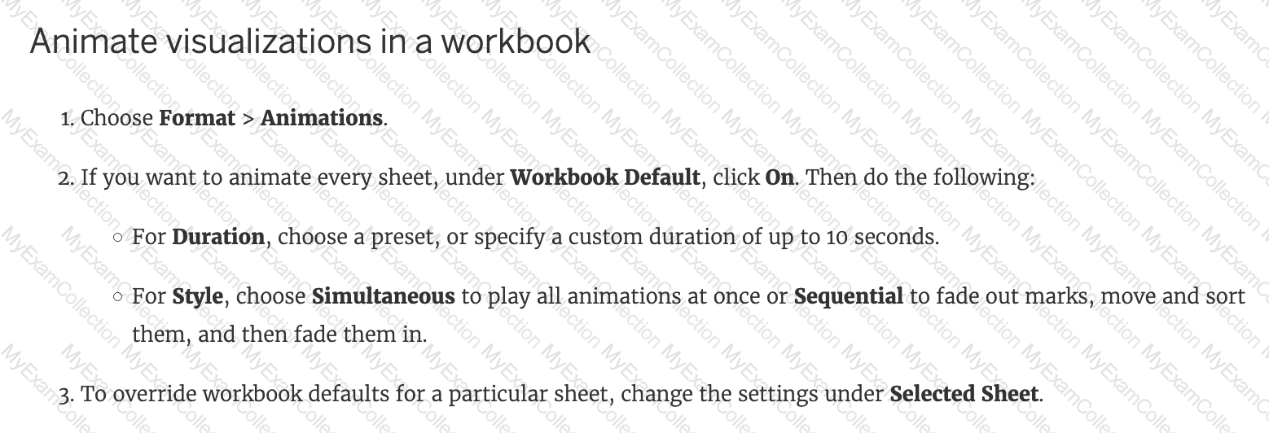
When using Animations in a Tableau, which of the following is the default duration for animations?
Question # 92
Which of the following URLÂ prefixes are permitted when creating a URLÂ Action in Tableau?
Question # 93
Given a map, which of the following fields can be placed on Size,Shape,Detail,Color
Question # 94
True or False: A sheet cannot be used within a story directly. Either sheets should be used within a dashboard, or a dashboard should be used within a story.
Question # 95
The default path for all supporting files, data sources, icons, logs etc is in ______________________