Question # 4
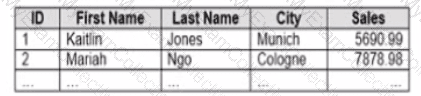
You company has two divisions located in the United States and Germany Bach division has a separate database. The following is a sample of the sales data for the division in the United States.
The following is a sample of the sales data for me division in Germany.
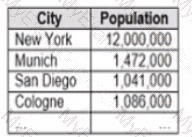
You have population data in a file named Populatio.csv. the following is a sample of the data.
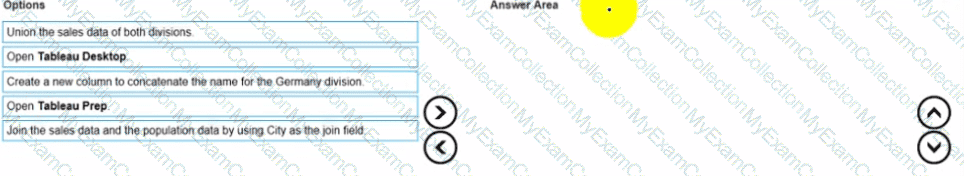
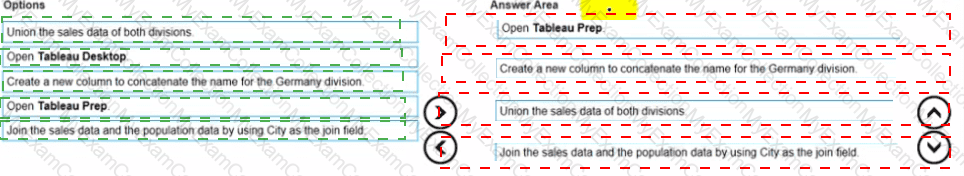
You plan to create a visualization that ml show tie sales per capita for each salesperson Each salesperson must be identified by identified by their full name.
You need to prepare the data to support the planned visualization. The data source must support being published .
Which four actions should you perform in order?
(Place the four correct options n order Use the arrows to move Options to Answer Area arrows to re-order the options.
Use Answer Area arrows to re-order the options)
Question # 5
Open the link to Book1 found on the desktop. Open the Histogram worksheet and use the Superstone data source.
Create a histogram on the Quantity field by using bin size of 3.
Question # 6
You have a database that includes field named sales, City and Region.
You have the following chart that shows the number of sales made in different cities.
You want to dynamically show the corresponding region when users hover their mouse over any of the bars.
What should you do?
Question # 7
A colleague provides you with access to a folder that contains the following files:
• Sates.csv
• Bookl.twb
• Sates.hyper
• Export.mdb
Which He contains an extract?
Question # 8
You have the following tiled dashboard that has one sheet.
You want to replace the sheet with Sheet2.
What should you do?
Question # 9
You have the following dataset.
Which Level of Detail (LOD) expression should you use to calculate tie grand total of all the regions?
Question # 10
You have the following dataset.
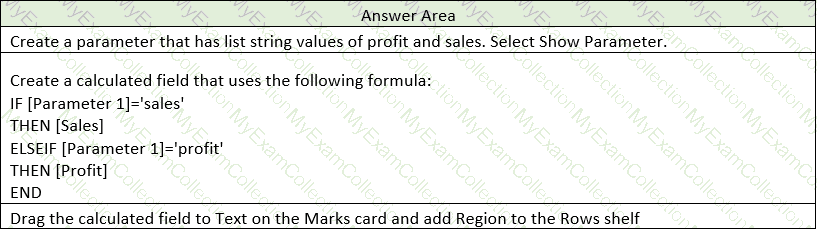
You need to create the following worksheet.
The table must show either profit or sales based on the selection from the Parameter 1 menu.
Which three actions should you perform in orders
(Place the three correct options in order Use the arrows to move Options lo Answer Area Use Answer Area arrows to reorder the options)
 A screenshot of a computer
Description automatically generated
A screenshot of a computer
Description automatically generated
Question # 11
You plan to create a visualization that has a dual axis chart. The dual axis chart will contain a shape chart and a line chart will use the same measure named Population on the axis.
You need to configure be shapes to be much larger than the line.
What should you do?
Question # 12
You have the following two tables.
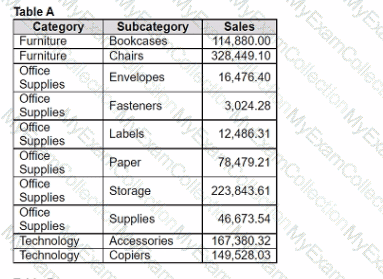
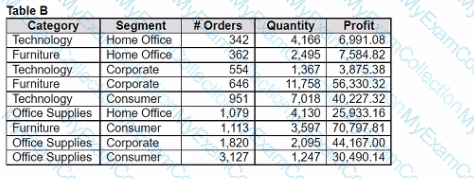
Table A is the primary table.
Which type of join is established when a blend is created by using the join key of Category?
Question # 13
You have the following dashboard that contains two visualizations.
You want to show only one visualization at time. Users must be able to switch between visualizations.
What should you me?
Question # 14
You need to change the values of a dimension without creating a new field.
What should you do?
Question # 15
You have a large data source that contains more than 10 million rows. Users can filter the rows by a field named Animal.
The following is a sample of the data.
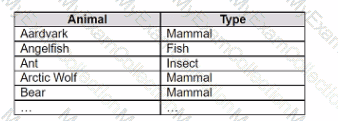
You want to improve the performance of the views by including only animals of a particular type.
To which filter should you add the Type field on the worksheet?
Question # 16
The following table displays the row-level data in a Tableau data source:
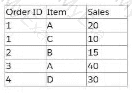
A Data Analyst creates this calculated field:
SUM(IF [Item] = 'A' THEN [Sales] END) / COUNT([Order ID])
What is the result of this aggregate calculation?
Question # 17
How should a Data Analyst sort data by Sales across multiple dimensions in Tableau?
Question # 18
A Data Analyst has the following view.
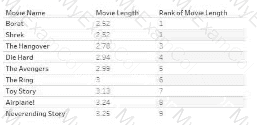
The analyst wants to filter the view to show only records that have a movie name starting with the word "The". The analyst must achieve the goal without writing any formulas.
Which type of filter should the analyst use?
Question # 19
A Data Analyst has the following chart.
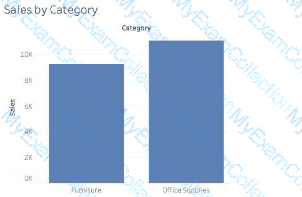
The analyst needs to enable the drilldown from Category to Subcategory as shown in the following chart.
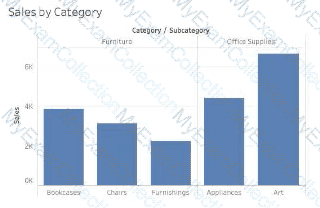
What should the analyst create?
Question # 20
You are creating an annual report in Microsoft Word.
In Tableau Desktop, you build a chart in a worksheet.
You want to create an image of the chart that you can add to the annual report.
What are two ways to create the image? Choose two.
Question # 21
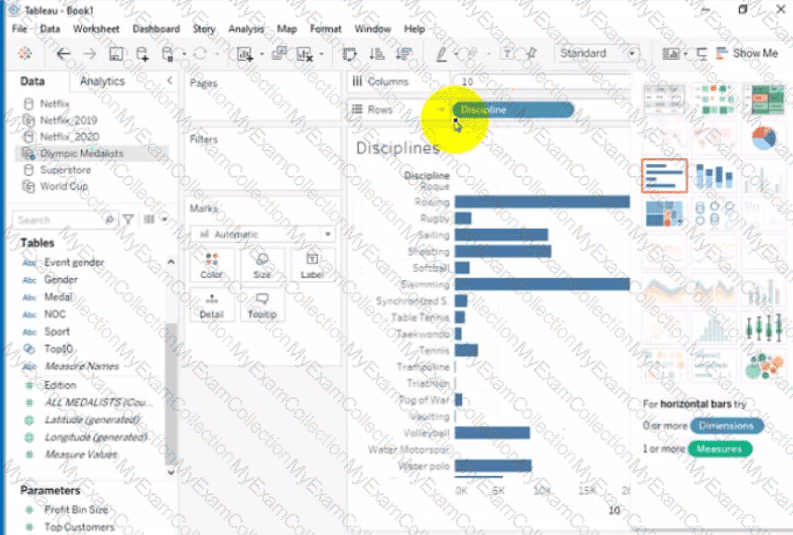
Open the link to Book1 found on the desktop. Open Disciplines worksheet.
Filter the table to show the Top 10 NOC based on the number of medals won.
Question # 22
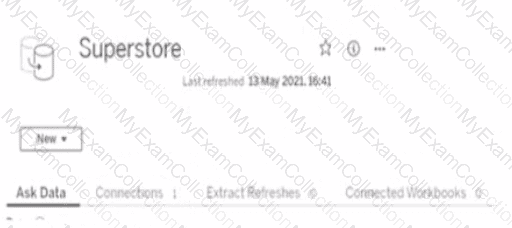
Open the link to Book1 found on the desktop. Use the Superstore data source.
Split the Customer Name field into two fields named First Name and Last Name.
Question # 23
You have the following data source in tableau Server.
You need to ensure that the data is updated every hour.
What should you select?
Question # 24
Open the link to Book1 found on the desktop. Open the sales dashboard.
Add the Sales by State sheet in a Show/Hide button to the right side of the dashboard.
Question # 25
Open the link to Book1 found on the desktop. Open the Movie Durations worksheet.
Replace the existing data source with the Netflix_2019 data source.
Question # 26
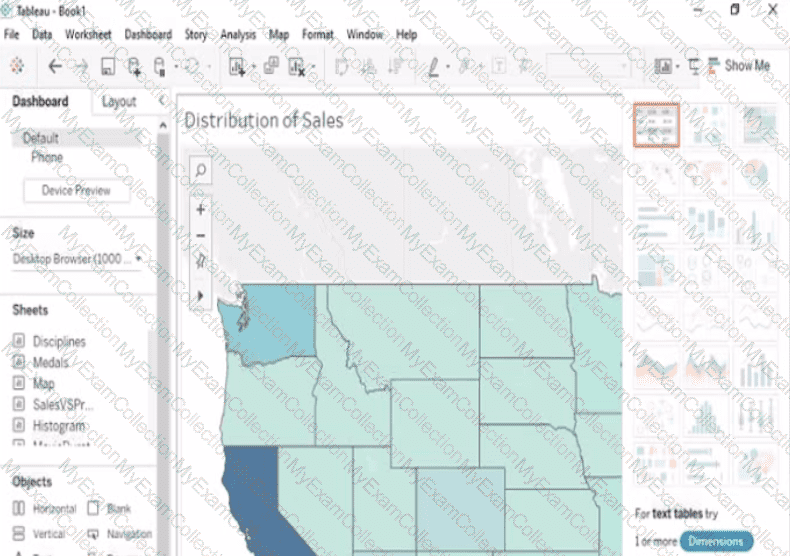
Open the Link to Book1 found on the desktop. Open Map worksheet and use Superstore data source.
Create a filed map to show the distribution of total Sales by State across the United States.
Question # 27
Open the link to Book1 found on the desktop. Open the Line worksheet.
Modify the chart to show only main and max values of both measures in each region.
Question # 28
Open the link to Book1 found on the desktop. Open SalesVSProfit worksheet.
Add a distribution band on Profit to show the standard deviation from- 1 to 1.
Question # 29
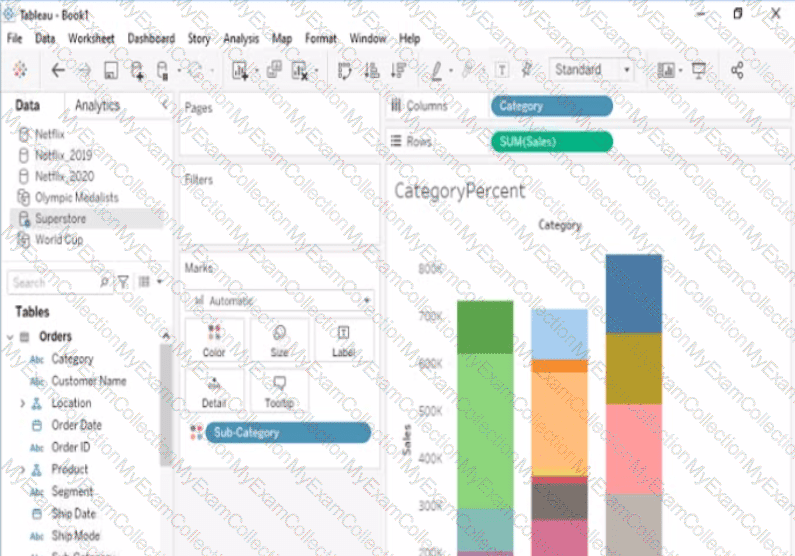
Open the link to Book1 found on the desktop. Open the CategoryPercentage worksheet.
Modify the bar chart show the percentage of sales for each Subcategory within every Category. The total percentage for every Category must be 100%.
Question # 30
Open the link to Book1 found on the desktop. Open Disciplines worksheet.
Filter the table to show the members of the Top10 set and the members of the Bottom10 set. There should be a total of 20 rows.
Question # 31
You have the following box plot that shows the distribution of average profits made in every state by region.
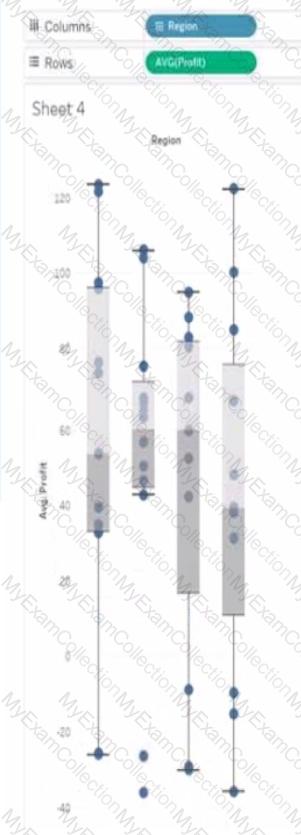
Which region has the smallest distribution of profits?
Question # 32
You want to add a comment to March 2020 as shown in the following visualization.
You have the following sets in a Tableau workbook
• Top N Customers
• Customers of 2020
• Top N Products
• Sellers of 2020
Which two sets can you combine? Choose two
Question # 33
You have the following line chart that shows the average sales by month.
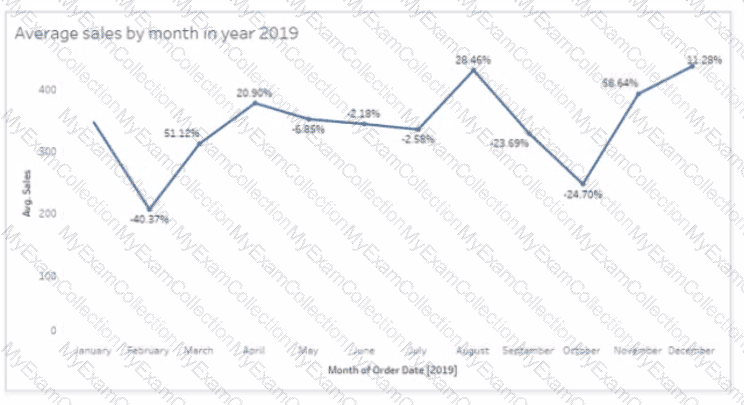
Which month had the biggest increase in swage sales compared to me previous month in 2019?
Question # 34
You have the following dashboard.
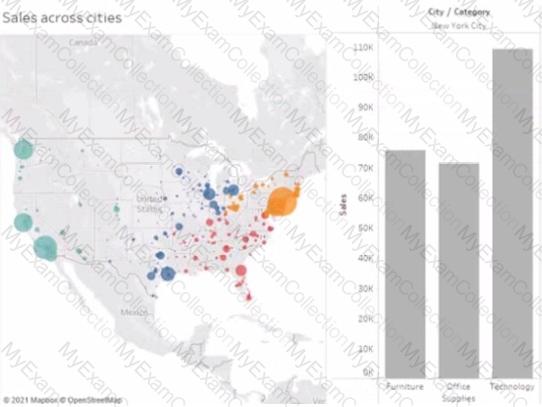
When a user selects a only on the map the data on the bar chart must show only the data for the selected city. The data in the bar chart must change only when the user selects a different city How should you configure the dashboard action? (Use the dropdowns in the Answers Area to select the correct options.)

Question # 35
You have the following dataset.
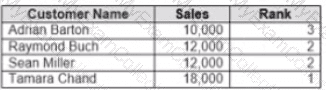
Yon need to calculate the ranking shown in the Rank field.
How should you complete the formula? (Use the dropdowns in the Answer Area to select the correct options to complete the formula ?


Question # 36
You have the Mowing dashboard.
Which two elements are floating? Choose two.