Question # 4
Which of the following are supported rollup functions in Splunk Observability Cloud?
Question # 5
In the Splunk distribution of the OpenTelemetry Collector, what is the difference between the agent_config.yaml and the splunk-otel-collector.conf files?
Question # 6
Which analytic function can be used to discover peak page visits for a site over the last day?
Question # 8
To refine a search for a metric a customer types host: test-*. What does this filter return?
Question # 9
A customer wants to share a collection of charts with their entire SRE organization. What feature of Splunk Observability Cloud makes
this possible?
Question # 10
Which of the following are correct ports for the specified components in the OpenTelemetry Collector?
Question # 11
Which of the following are ways to reduce flapping of a detector? (select all that apply)
Question # 12
A customer is experiencing issues getting metrics from a new receiver they have configured in the OpenTelemetry Collector. How would the customer go about troubleshooting further with the logging exporter?
A.
Adding debug into the metrics receiver pipeline:

B.
Adding logging into the metrics receiver pipeline:

C.
Adding logging into the metrics exporter pipeline:

D.
Adding debug into the metrics exporter pipeline:

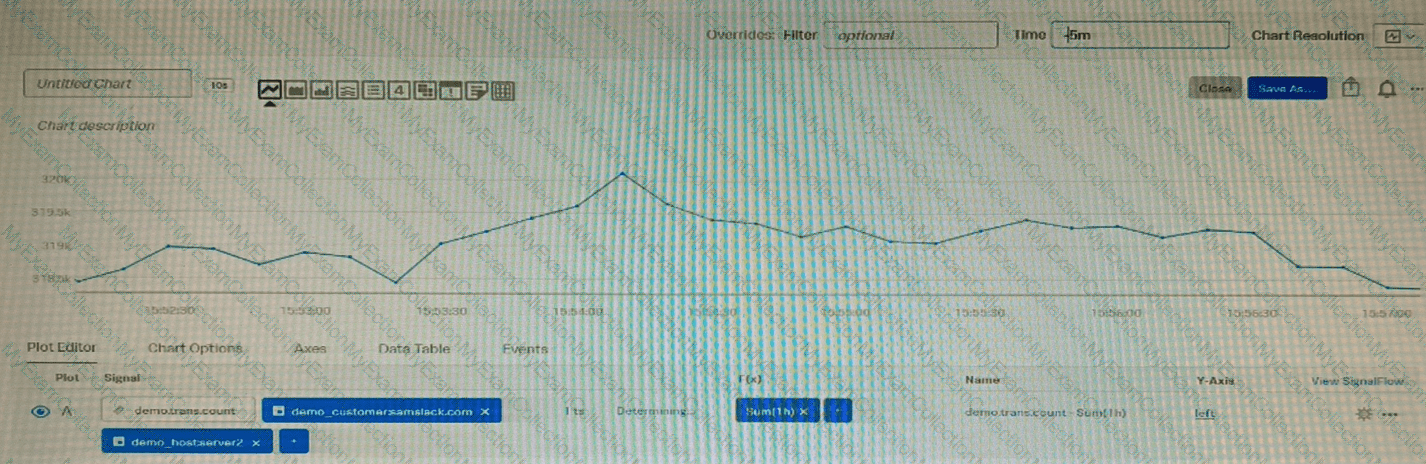
Question # 13
Given that the metric demo. trans. count is being sent at a 10 second native resolution, which of the following is an accurate description of the data markers displayed in the chart below?
Question # 14
Which of the following statements are true about the datatable on a chart? (select all that apply)
Question # 15
A user wants to add a link to an existing dashboard from an alert. When they click the dimension value in the alert message, they are taken to the dashboard keeping the context. How can this be accomplished? (select all that apply)
Question # 17
Which of the following can be configured when subscribing to a built-in detector?