Question # 4
You have four sales regions. Each region has multiple sales managers.
You implement row-level security (RLS) in a data model. You assign the relevant distribution lists to each role.
You have sales reports that enable analysis by region. The sales managers can view the sales records of their region. The sales managers are prevented from viewing records from other regions.
A sales manager changes to a different region.
You need to ensure that the sales manager can see the correct sales data.
What should you do?
Question # 5
You have an on-premises Power BI Report Server.
You plan to create a report in Power BI Desktop and publish the report to the report server.
Which data source should the report use?
Question # 6
Which two types of visualizations can be used in the balance sheet reports to meet the reporting goals? Each correct answer presents part of the solution.
NOTE: Each correct selection is worth one point.
Question # 7
You have more than 100 published datasets.
Ten of the datasets were verified to meet your corporate quality standards.
You need to ensure that the 10 verified datasets appear at the top of the list of published datasets whenever users search for existing datasets.
What should you do?
Question # 8
What should you create to meet the reporting requirements of the sales department?
Question # 9
You have a Microsoft Power Bl report. The size of PBIX file is 550 MB. The report is accessed by using an App workspace in shared capacity of powerbi.com.
The report uses an imported dataset that contains one fact table. The fact table contains 12 million rows. The dataset is scheduled to refresh twice a day at 08:00 and 17:00.
The report is a single page that contains 15 custom visuals and 10 default visuals.
Users say that the report is slow to load the visuals when they access and interact with the report
You need to recommend a solution to improve the performance of the report.
What should you recommend?
Question # 10
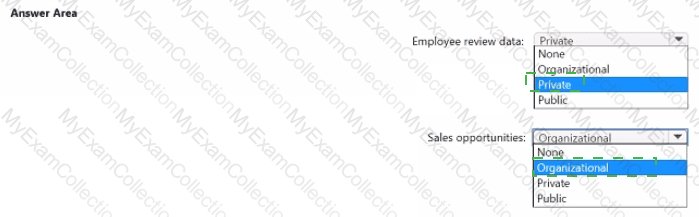
You have a Power Bl semantic model that contains the data sources shown in the following table.
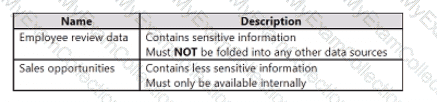
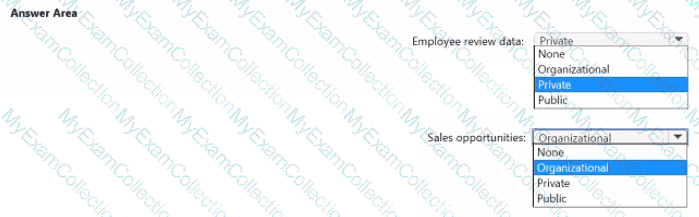
You need to configure the privacy levels of the data sources.
What should you configure (01 each data source? To answer, select (he appropriate options in the answer area.
NOTE: Each correct answer is worth one point.
Question # 11
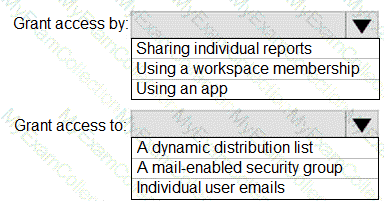
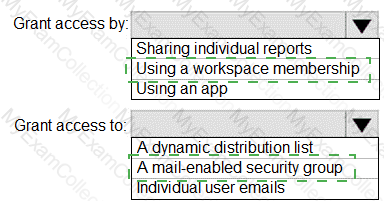
How should you distribute the reports to the board? To answer, select the appropriate options in the answer area.
NOTE: Each correct selection is worth one point.
Question # 12
You have a Power Bl report hosted on powerbi.com that displays expenses by department for department managers.
The report contains a line chart that shows expenses by month.
You need to enable users to choose between viewing the report as a line chart or a column chart. The solution must minimize development and maintenance effort.
What should you do?
Question # 13
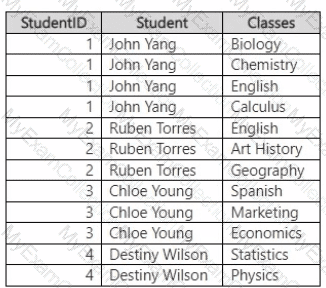
You have a query in Power Query Editor that contains the following data.
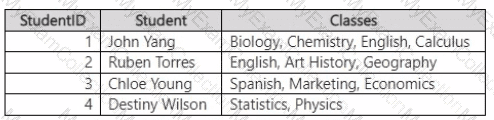
You need to transform the data to appear as shown in the following table.
What should you do?
Question # 14
You need to get data from the Microsoft SQL Server tables. What should you use to configure the connection'
Question # 15
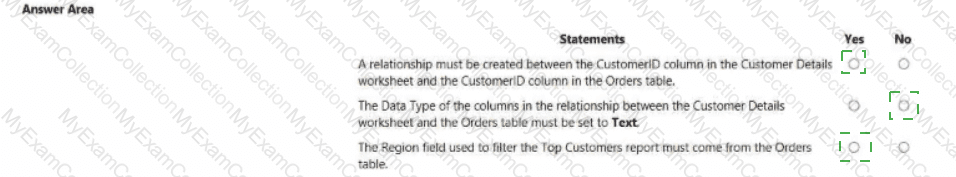
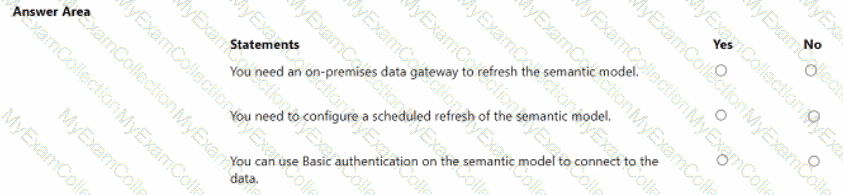
You publish the semantic model to powerbi.com.
For each of the following statements, select Yes if the statement is true. Otherwise, select No.
NOTE: Each correct selection is worth one point.
Question # 16
You need to address the data concerns before creating the data model. What should you do in Power Query Editor?
Question # 17
You need to create a calculated column to display the month based on the reporting requirements. Which DAX expression should you use?
Question # 18
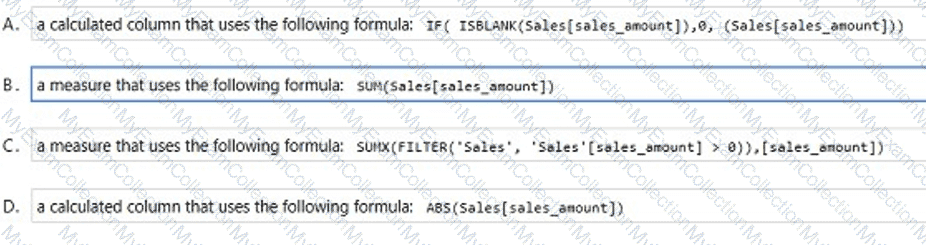
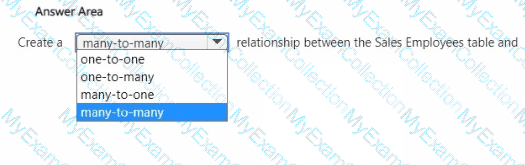
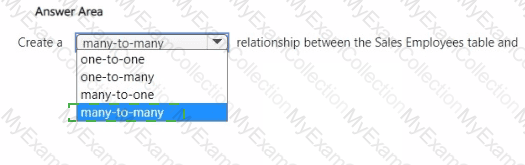
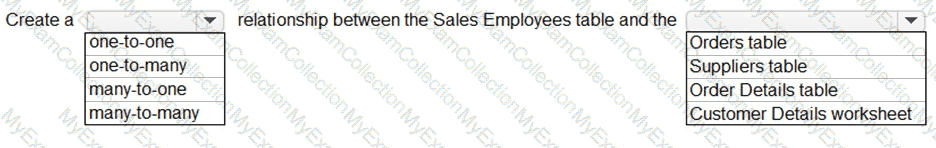
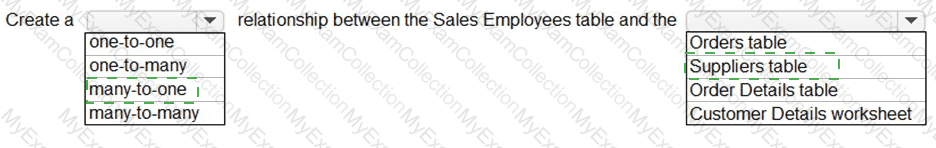
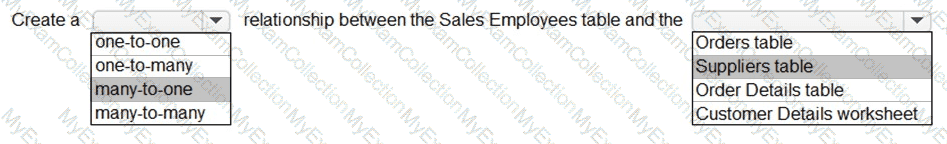
You need to create relationships to meet the reporting requirements of the customer service department.
What should you create?
Question # 19
You need to provide a solution to provide the sales managers with the required access.
What should you include in the solution?
Question # 20
You need to create the required relationship for the executive's visual. What should you do before you can create the relationship?
Question # 21
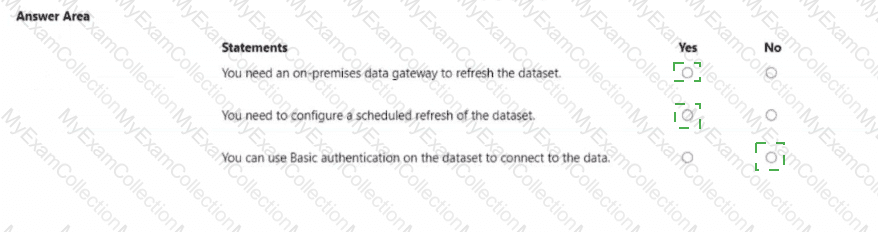
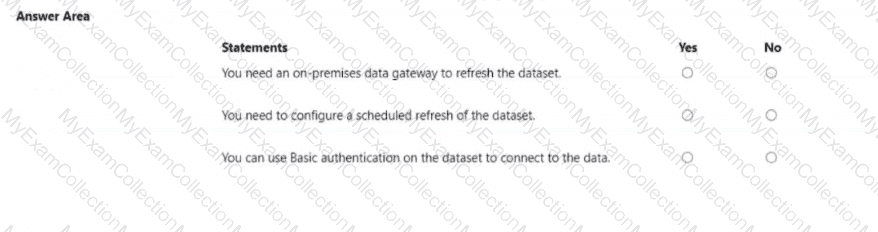
You publish the dataset to powerbi.com.
For each of the following statements, select Yes if the statement is true. Otherwise, select No.
NOTE: Each correct selection is worth one point.

Question # 22
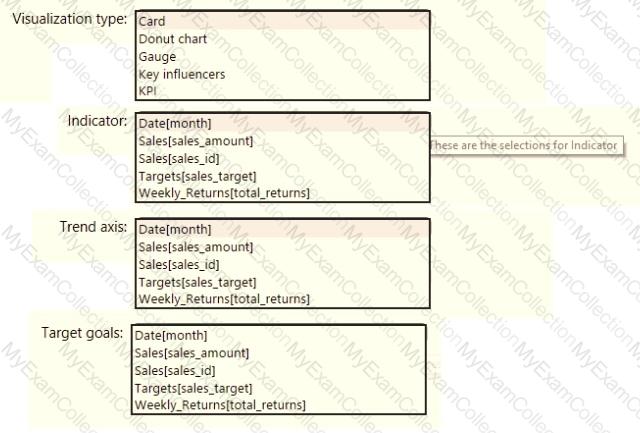
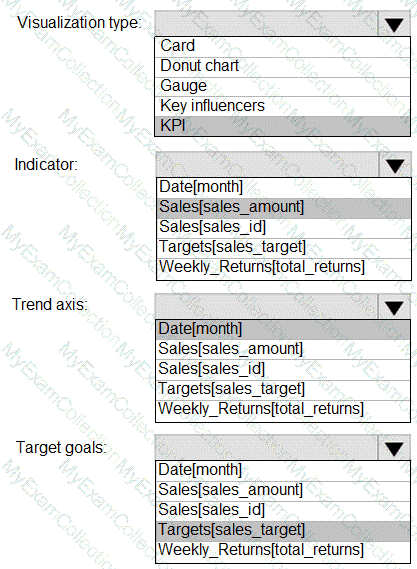
You need to create a visualization to meet the reporting requirements of the sales managers.
How should you create the visualization? To answer, select the appropriate options in the answer area.
NOTE: Each correct selection is worth one point.

Question # 23
What should you create to meet the reporting requirements of the sales department?
Question # 24
You need to create a relationship between the Weekly_Returns table and the Date table to meet the reporting requirements of the regional managers. What should you do?
Question # 25
You need to ensure that the data is updated to meet the report requirements. The solution must minimize configuration effort.
What should you do?
Question # 26
What is the minimum number of datasets and storage modes required to support the reports?
Question # 27
Which DAX expression should you use to get the ending balances in the balance sheet reports?
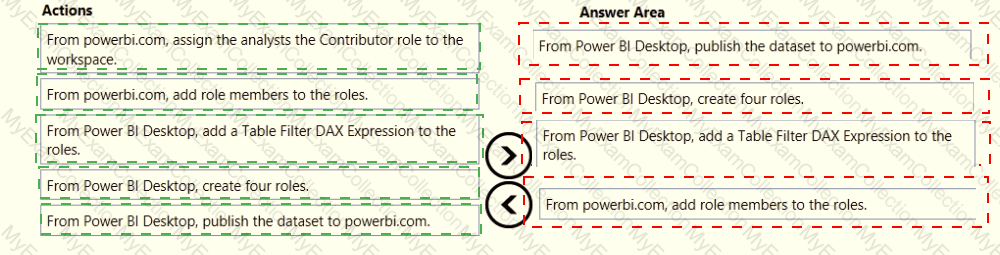
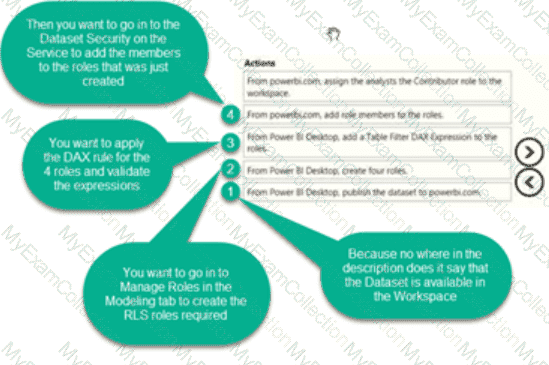
Question # 28
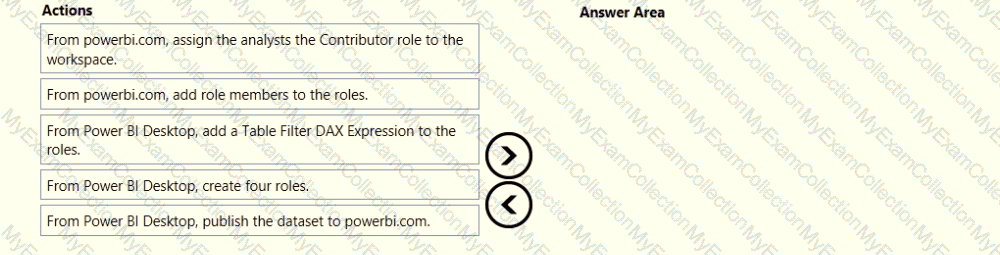
Once the profit and loss dataset is created, which four actions should you perform in sequence to ensure that the business unit analysts see the appropriate profit and loss data? To answer, move the appropriate actions from the list of actions to the answer area and arrange them in the correct order.
Question # 29
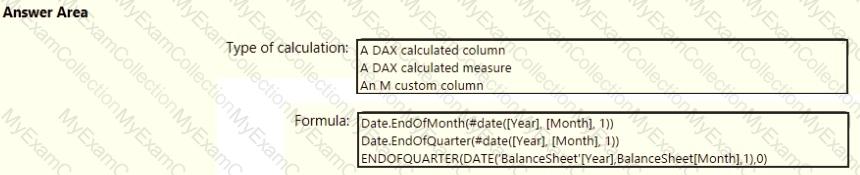
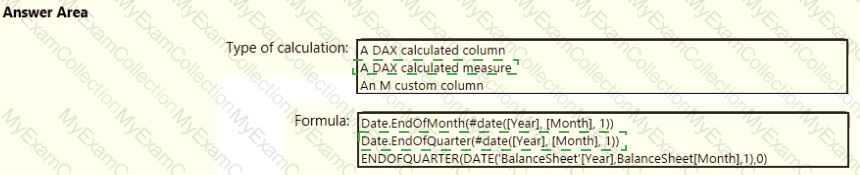
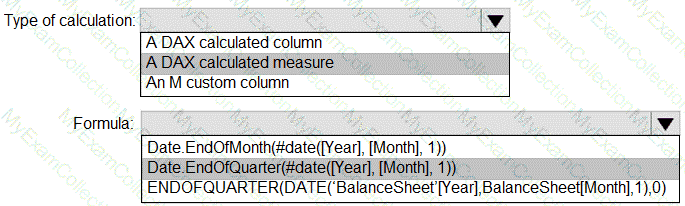
You need to calculate the last day of the month in the balance sheet data to ensure that you can relate the balance sheet data to the Date table. Which type of calculation and which formula should you use? To answer, select the appropriate options in the answer area. NOTE: Each correct selection is worth one point.
Question # 30
You need to recommend a strategy to consistently define the business unit, department, and product category data and make the data usable across reports.
What should you recommend?
Question # 31
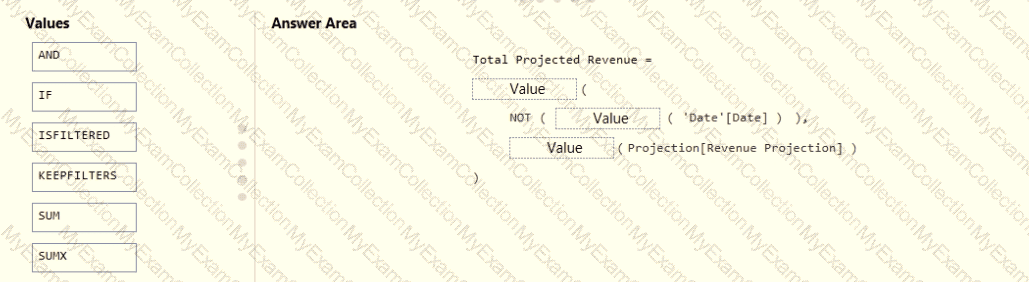
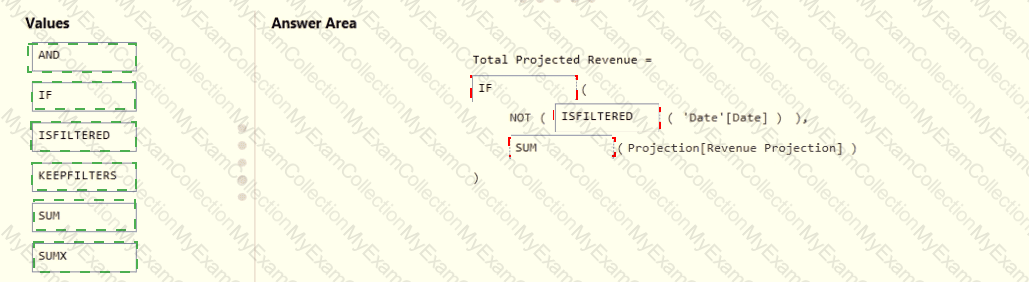
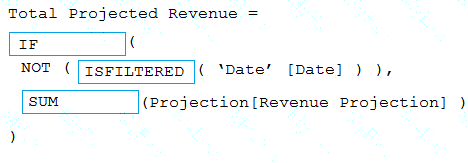
You need to create a DAX measure in the data model that only allows users to see projections at the appropriate levels of granularity.
How should you complete the measure? To answer, drag the appropriate values to the correct targets. Each value may be used once, more than once, or not at all. You may need to drag the split bar between panes or scroll to view content.
NOTE: Each correct selection is worth one point.
Question # 32
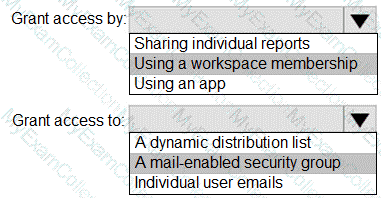
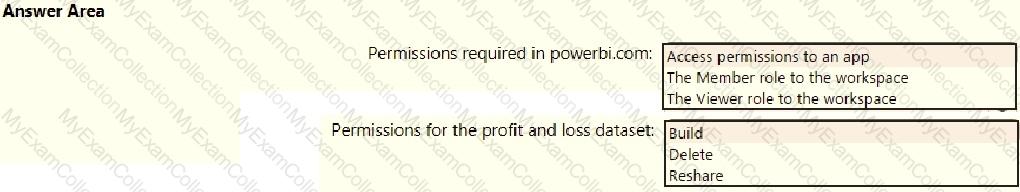
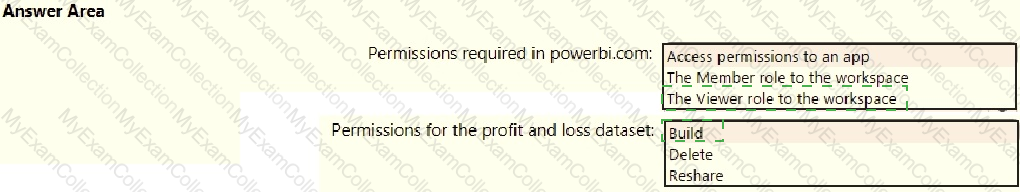
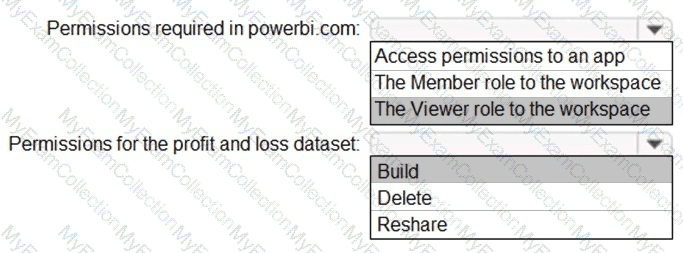
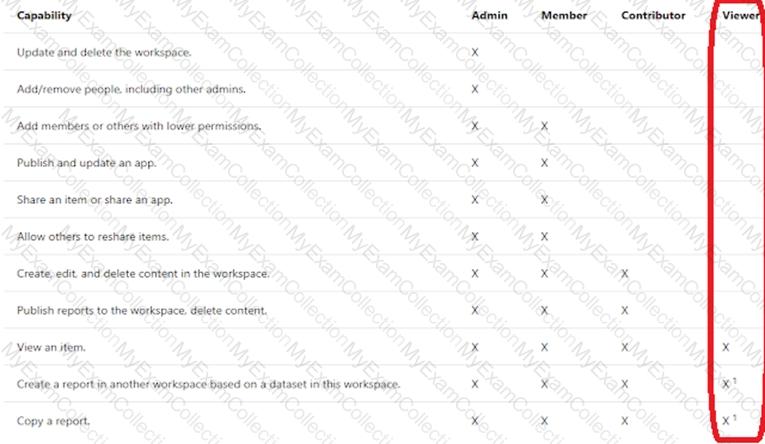
You need to grant access to the business unit analysts.
What should you configure? To answer, select the appropriate options in the answer area.
NOTE: Each correct selection is worth one point.
Question # 33
You need to create the relationship between the product list and the revenue results. The solution must minimize the time it takes to render visuals.
What should you set as the relationship cardinality?
Question # 34
You need to minimize the size of the semantic model. The solution must meet the report requirements.
What should you do?
Question # 35
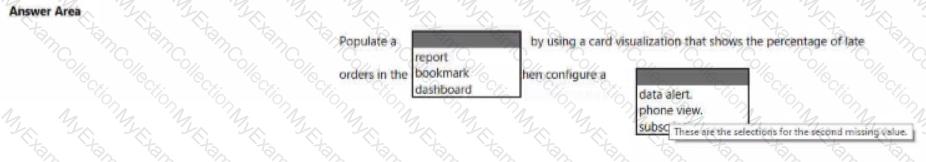
You need to create a solution to meet the notification requirements of the warehouse shipping department.
What should you do? To answer, select the appropriate options in the answer area.
NOTE: Each correct select is worth one point:

Question # 36
You need to create the On-Time Shipping report. The report must include a visualization that shows the percentage of late orders.
Which type of visualization should you create?
Question # 37
You need to create a relationship in the data model for RLS.
What should you do? To answer, select the appropriate options in the answer area.
NOTE: Each correct selection is worth one point.
Question # 38
You use Power Query to import two tables named Order Header and Order Details from an Azure SQL database. The Order Header table relates to the Order Details table by using a column named Order ID in each table.
You need to combine the tables into a single query that contains the unique columns of each table.
What should you select in Power Query Editor?
Question # 39
You need to minimize me size of the dataset. The solution must meet the report requirements What should you do?
Question # 40
You need to create the semantic model.
Which storage mode should you use for the tables in the semantic model?
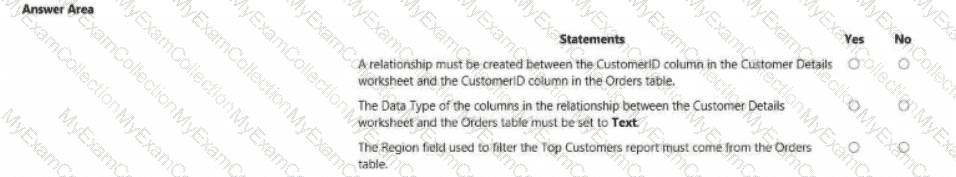
Question # 41
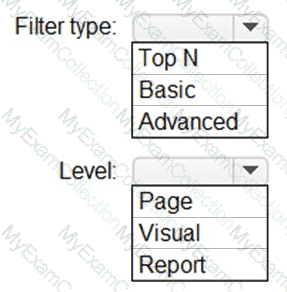
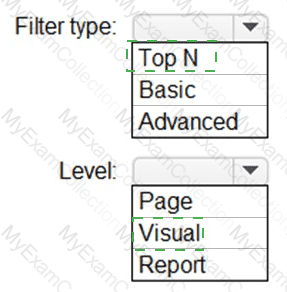
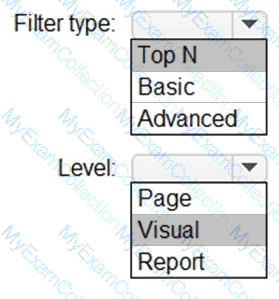
You need to create the Top Customers report.
Which type of filter should you use, and at which level should you apply the filter? To answer, select the appropriate options in the answer area.
NOTE: Each correct selection is worth one point.
Question # 42
You need to create a relationship in the dataset for RLS.
What should you do? To answer, select the appropriate options in the answer area.
NOTE: Each correct selection is worth one point.
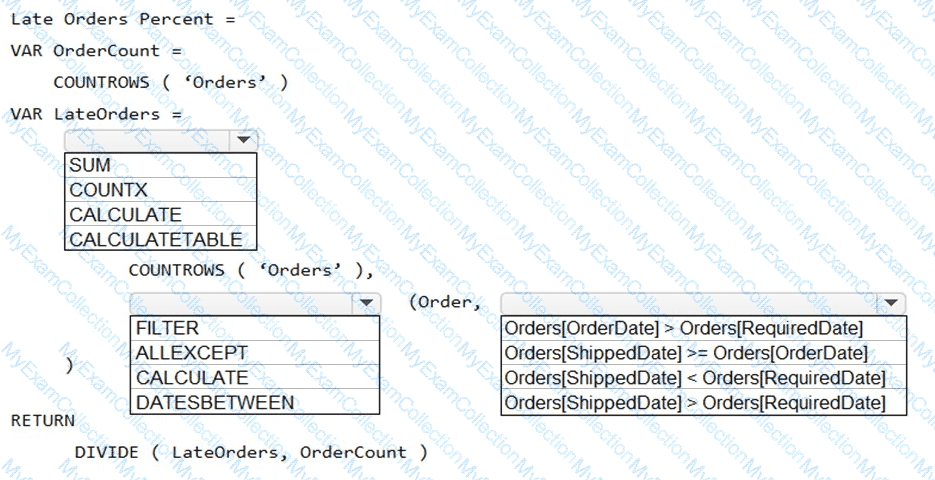
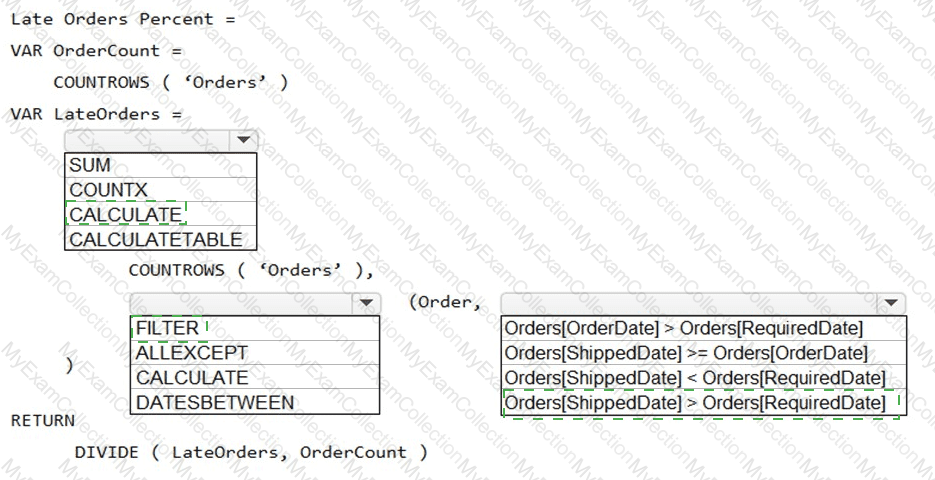
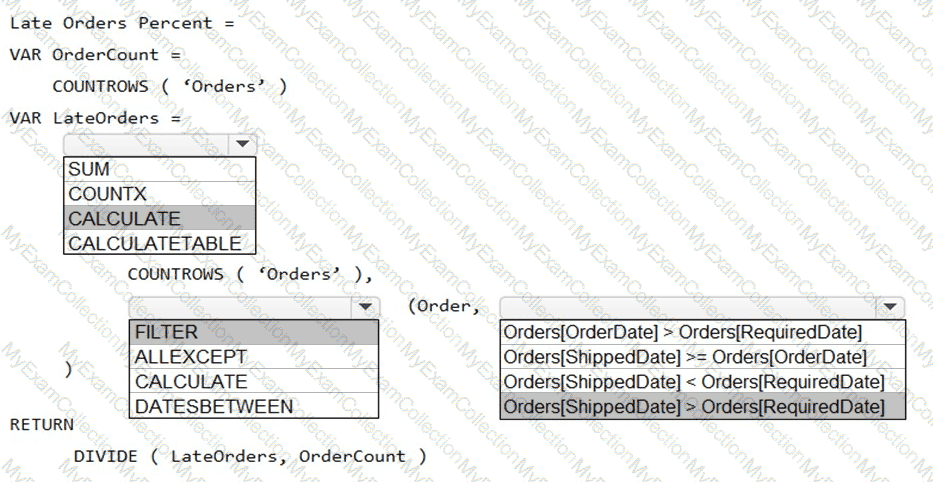
Question # 43
You need to create a measure that will return the percentage of late orders.
How should you complete the DAX expression? To answer, select the appropriate options in the answer area.
NOTE: Each correct selection is worth one point.