Question # 4
The primary objective in removal of waste is to improve the Order Production Cycle where the time from _________________ to the time of receipt of payment is compressed.
Question # 5
Contingency Tables are used to test for association, or dependency, between two or more classifications.
Question # 6
The Mann-Whitney test is a powerful test and is unique to situations from which of the choices listed? (Note: There are 2 correct answers).
Question # 7
Early in a project a Belt will want to begin to identify and evaluate risk factors for the subject process and will therefore begin building a(n) ________.
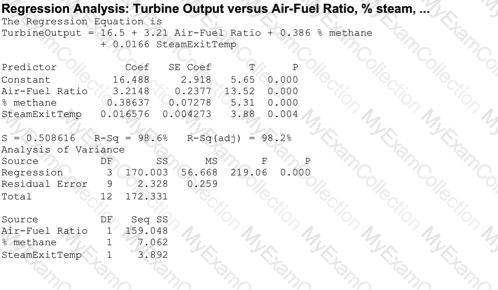
Question # 8
It would be more likely than not for a Belt conducting a Regression Analysis to find that the _______________________.
Question # 9
Screening experiments are the proper choice when a Belt is faced with the situation of highly Fractional Factorial Designs.
Question # 10
A Belt working in a supply chain environment has to make a decision to change suppliers of critical raw materials for a new product upgrade. The purchasing manager is depending on the Belt’s effort requiring that the average cost of an internal critical raw material component be less than or equal to $4,200 in order to stay within budget. Using a sample of 35 first article components, a Mean of the new product upgrade price of $4,060, and a Standard Deviation of $98 was estimated. The Alternative Hypothesis in the above example is?
Question # 11
Using this partial Z Table, how many units from a month’s production run are expected to not satisfy customer requirements for the following process?
Upper specification limit: 8.4 Lower specification limit: 4.7 Mean of the process: 6.2 Standard Deviation: 2.2 Monthly production: 360 units
Question # 13
At the very initiation of a project a Belt must develop a concise _______________ that states at a high level the area of concern and why it is important this issue be improved.
Question # 14
On a _________________ a Belt screens variables, or various inputs, to analyze their relative impact on the output of concern.
Question # 15
A Personal Trainer was assessing her workout class participants for their body fat content and had to include data for her analysis. One of the columns listed the range of weight of the people included in the studies. This required plotting a Histogram of the weight of the people assessed for their body fat content. While drawing the Histogram the x-axis contained a certain scale of data. Pick the scale of data that is appropriate for Histograms.
Question # 16
When variation is removed from the output of a process then the process customer can have more confidence in the experience that results from the process.
Question # 17
Which of these graphs demonstrates conditions which would be sufficient to enable OCAP for the process?   Â
Question # 18
Each of the items listed would impact the Process Capability for a process with a continuous output except ___________________.
Question # 19
Sally and Sara sell flower pots at their garage sale. Sally motivates Sara mentioning that they will sell a minimum of 15 pots per day if the outside temperature exceeds 60o F. From a sample, whose population is assumed to follow a Normal Distribution, taken for 30 days at 60 degrees or more an average of 13.6 pots per day were sold with a Standard Deviation of 0.7 pots. For the sales accomplished above, what test would validate if they met their requirements?
Question # 20
What aspects of Measurement Systems Analysis (MSA) studies are applicable when the process used to measure does not damage the part?
Question # 21
How many experimental runs exist in a Full Factorial and fully randomized design for 5 factors with 2 replicates for the Corner Points and no Center Points? The factors in the experiment are only at 2-levels.
Question # 22
When we compare short-term and long-term Capability which of these is true?
Question # 23
With Measurement System Analysis we are concerned with two issues that impact the potential variability of the data. They are _____________________.
Question # 24
For Attribute Data, Process Capability is defined as the average proportion of nonconforming products.
Question # 25
What aspects of Measurement Systems Analysis (MSA) studies are applicable when the process used to measure does not damage the part?
Question # 27
One of the methods of testing a Measurement System is to have at least two people take multiple readings from the same instrument and of the same sample set to judge the Repeatability and Reproducibly. This approach is called a ______________ study.
Question # 28
Special Cause Variation falls into which two categories? (Note: There are 2 correct answers).
Question # 29
What is the Ppk of a process with a spread of 24 units, an average of 68, an upper limit of 82 and a lower limit of 54?
Question # 30
From this list select the items that define what an X-Y Diagram is. (Note: There are 4 correct answers).
Question # 32
Which of these are examples of business metrics or Key Performance Indicators commonly referred to as KPI’s?
Question # 33
Of the various types of data shown below which is NOT representative of Variable Data.
Question # 34
The relationship between a response variable and one or more independent variables is investigated and modeled by use of which of these?
Question # 35
A ___________ is used primarily to track the stability of the average value of a metric of interest.
Question # 37
Control Charts were developed by Dr. Shewhart to track data over time. To detect Special Cause variation the Control Charts use which of these?
Question # 39
Common and ______________ Cause Variation are the focus of Statistical Process Control.
Question # 40
The method of Steepest Ascent guides you toward a target inside the original inference space.
Question # 41
As a means of measuring the effects on other areas of a process as a result of changes in the primary metric we also define and track ________________.
Question # 42
Which statements are correct about the advanced Capability Analysis shown here?
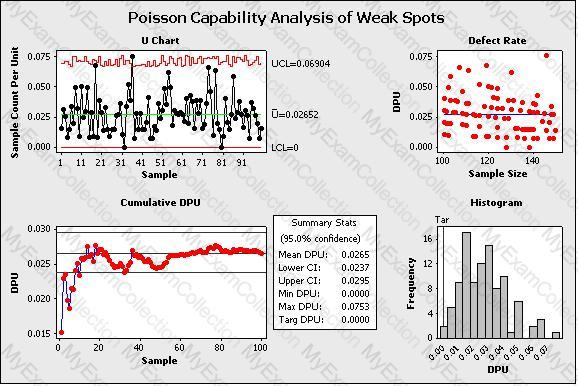
(Note: There are 3 correct answers).
Question # 43
Assessing process proportion as opposed to evaluating a process with respect to a set target can be done using one or more of these. (Note: There are 2 correct answers).
Question # 44
Range Charts are the technique used to determine if ______________ are occurring within the subgroups of the SPC Charts.
Question # 45
Which of these might contribute to similar distributions having Unequal Variance?