Question # 4
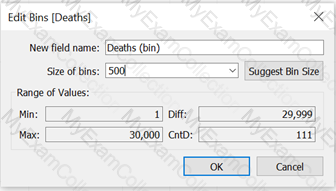
Connect to the "Significant Volcano Eruption" data source. Create a histogram using field Death and having a bin size of 500. Find out which country reported 9 deaths in the bin of 0-500?
 Graphical user interface, application
Description automatically generated
Graphical user interface, application
Description automatically generated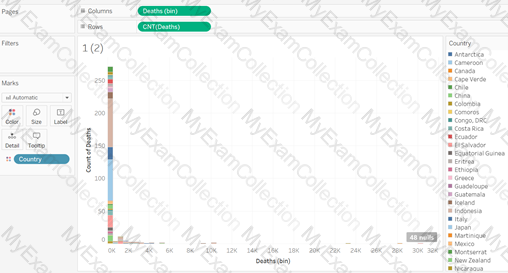 Chart
Description automatically generated
Chart
Description automatically generated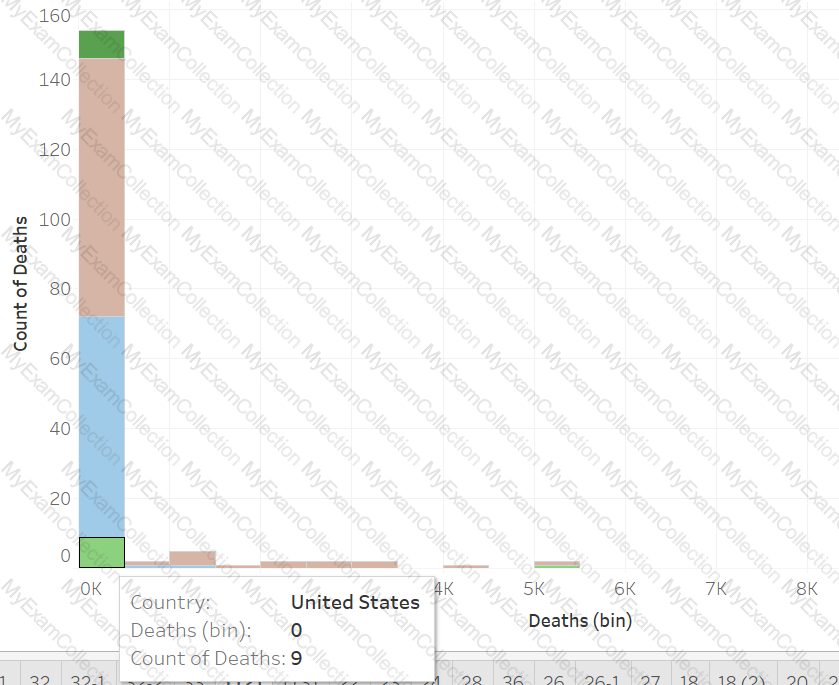 Chart
Description automatically generated
Chart
Description automatically generated Graphical user interface, application
Description automatically generated
Graphical user interface, application
Description automatically generated Graphical user interface, application
Description automatically generated
Graphical user interface, application
Description automatically generated
Question # 6
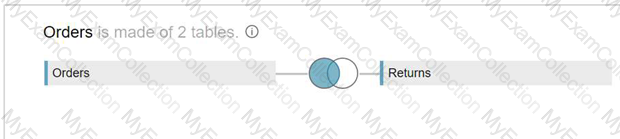
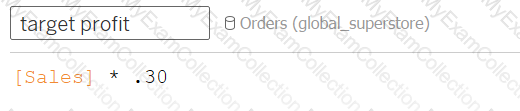
Connect to the "Global Superstore" data source and use the Orders table. Create a bar in bar chart and compare the profit against the target profit for Canada Region. Consider target profit is 30% of the sales. Which of the following sub-categories has met or exceed the target profit?
 Graphical user interface, application
Description automatically generated
Graphical user interface, application
Description automatically generated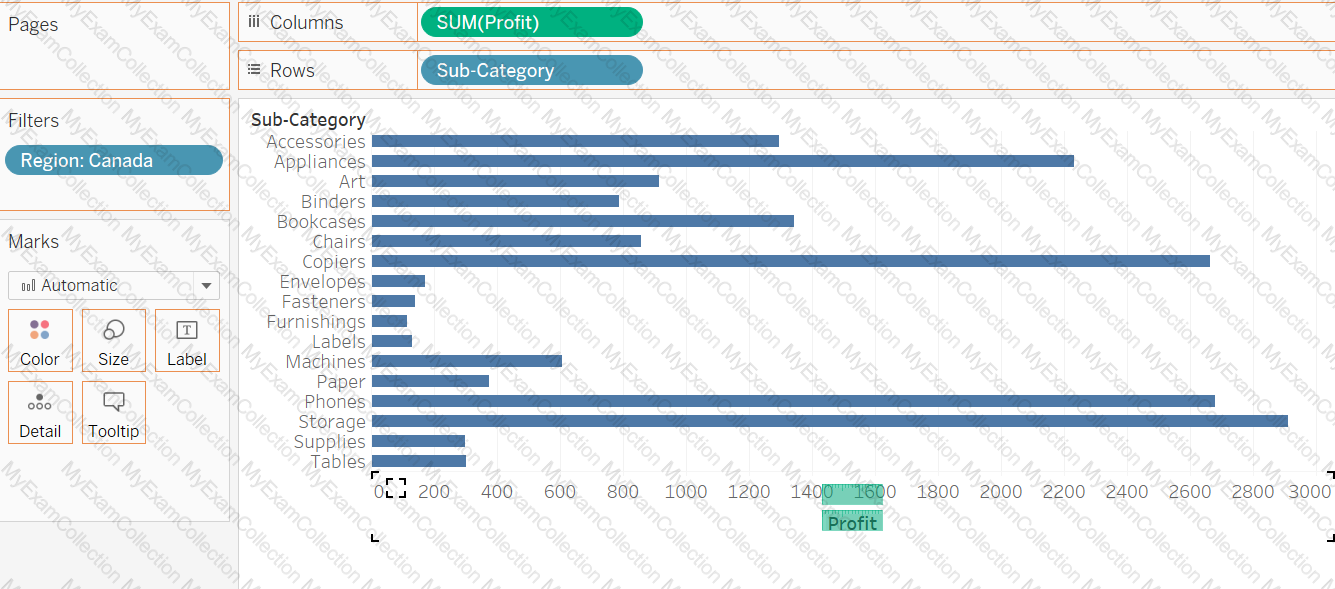 Chart, bar chart
Description automatically generated with medium confidence
Chart, bar chart
Description automatically generated with medium confidence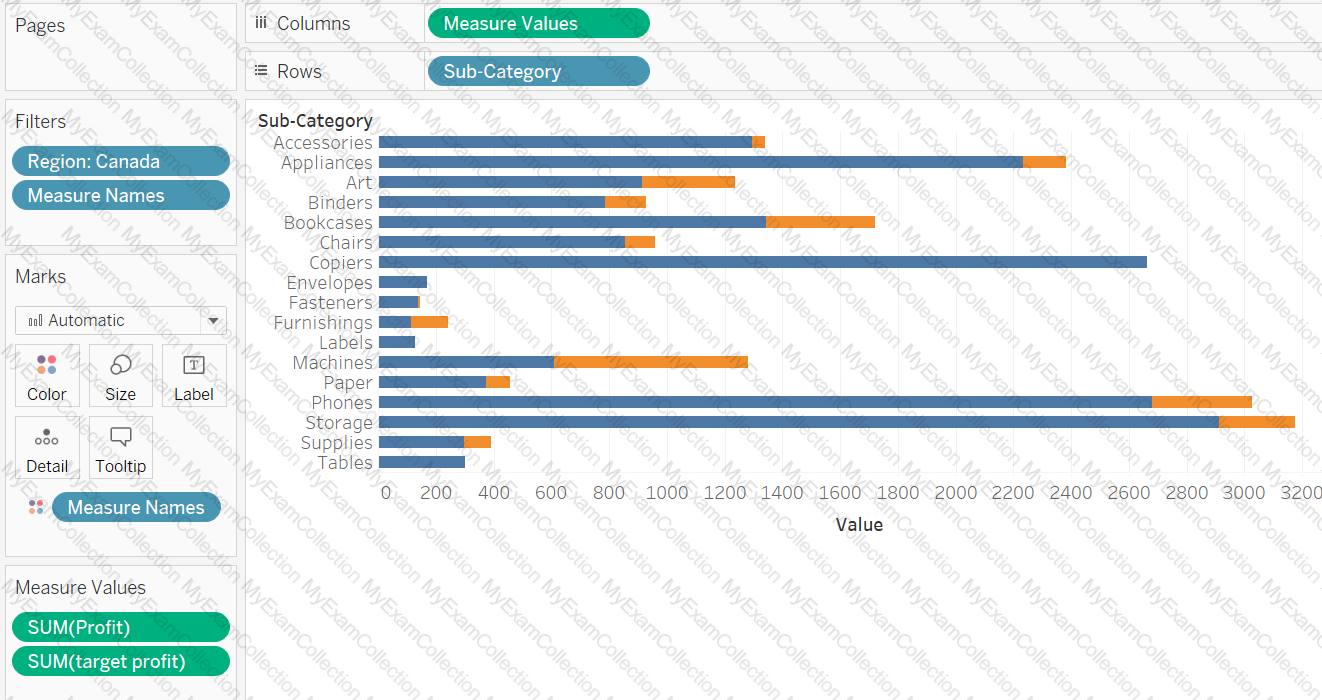 Chart, bar chart
Description automatically generated
Chart, bar chart
Description automatically generated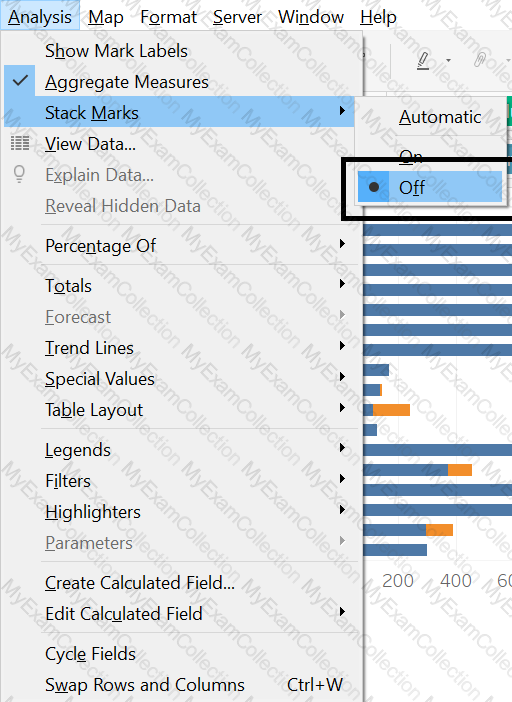 Graphical user interface
Description automatically generated with medium confidence
Graphical user interface
Description automatically generated with medium confidence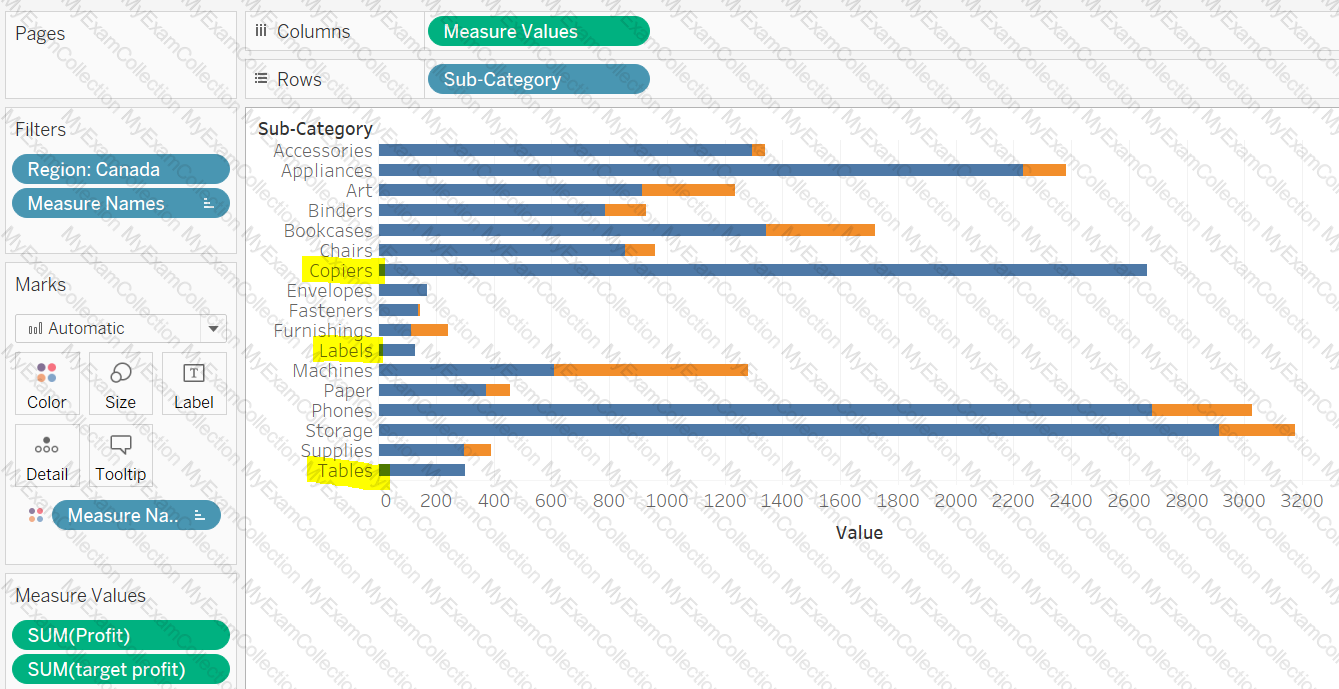 Chart
Description automatically generated
Chart
Description automatically generated
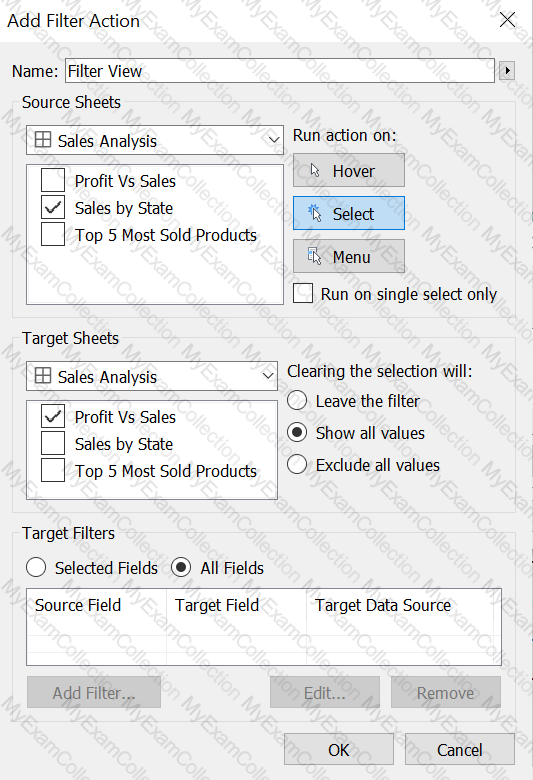
Question # 7
Using the Sales Analysis Dashboard, create a filter action that will trigger once you select any state in Sales by State View, and it should update the Profit Vs Sales view. Find out using trend lines in the Profit Vs Sales view, how much does profit increase for each dollar of sales for the California state?
 Graphical user interface
Description automatically generated
Graphical user interface
Description automatically generated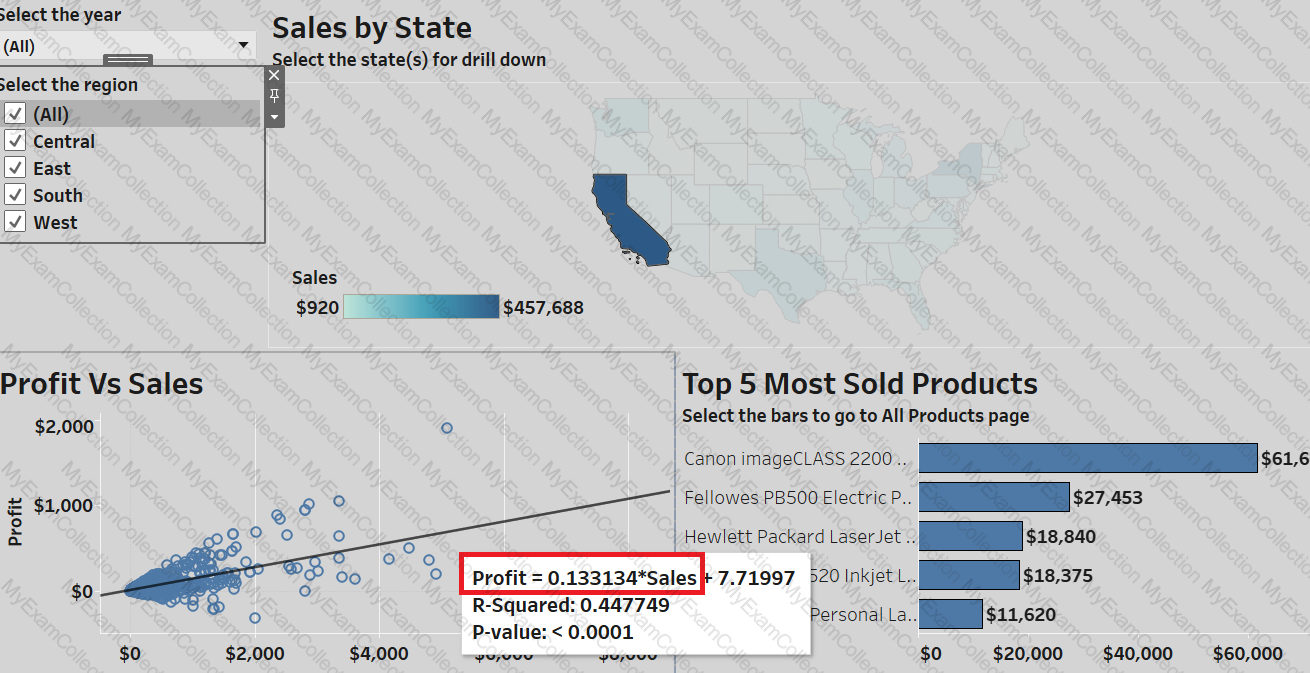 Map
Description automatically generated
Map
Description automatically generated
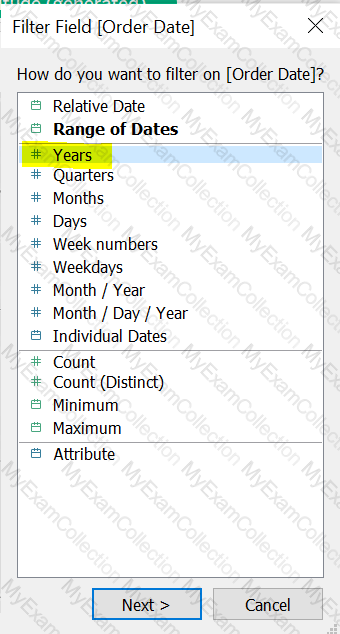
Question # 8
Connect to the "Global Superstore" data source and use the Orders table. Find out the group of states(in the US) having the highest sales in 2013?
 Graphical user interface, application
Description automatically generated
Graphical user interface, application
Description automatically generated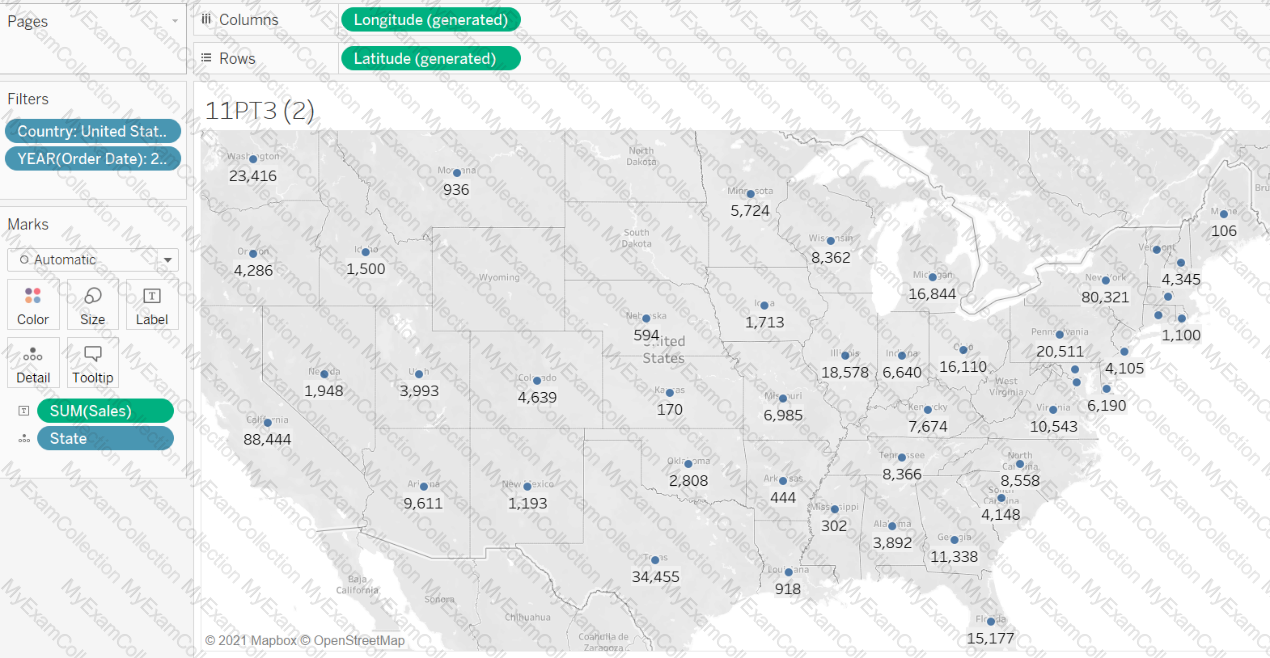 Graphical user interface
Description automatically generated with medium confidence
Graphical user interface
Description automatically generated with medium confidence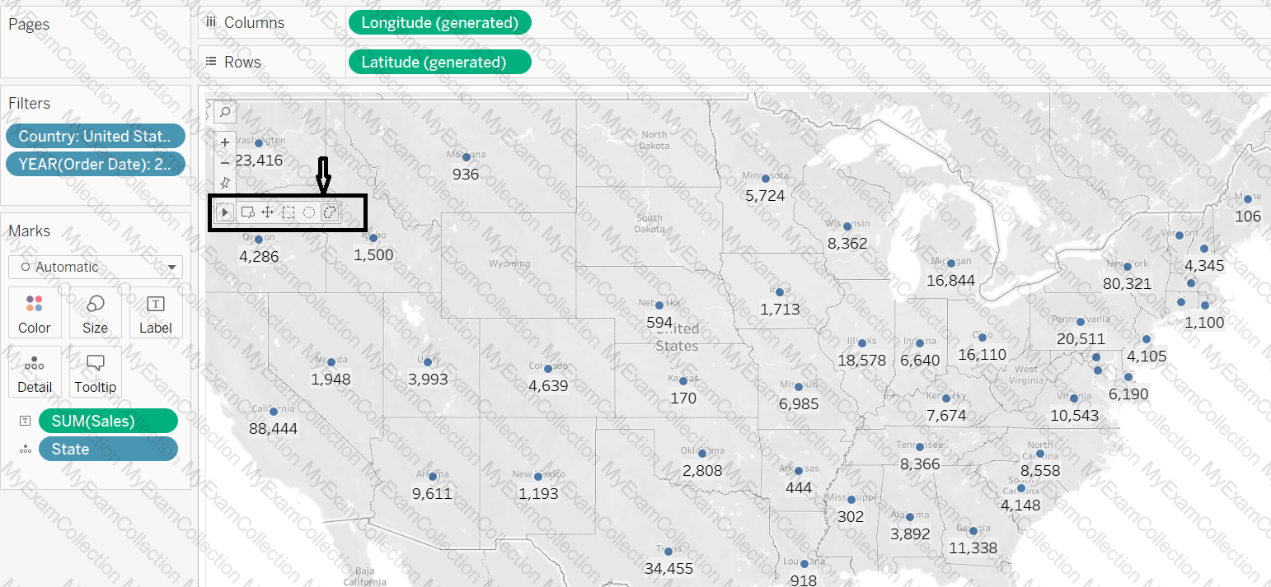 Graphical user interface, diagram
Description automatically generated
Graphical user interface, diagram
Description automatically generated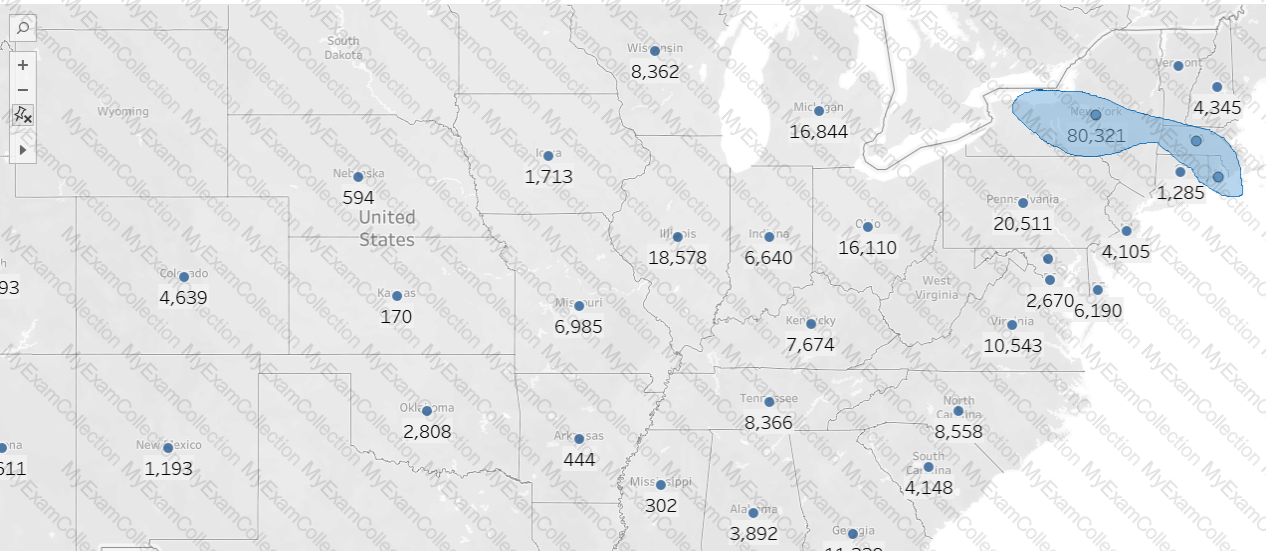 Map
Description automatically generated
Map
Description automatically generated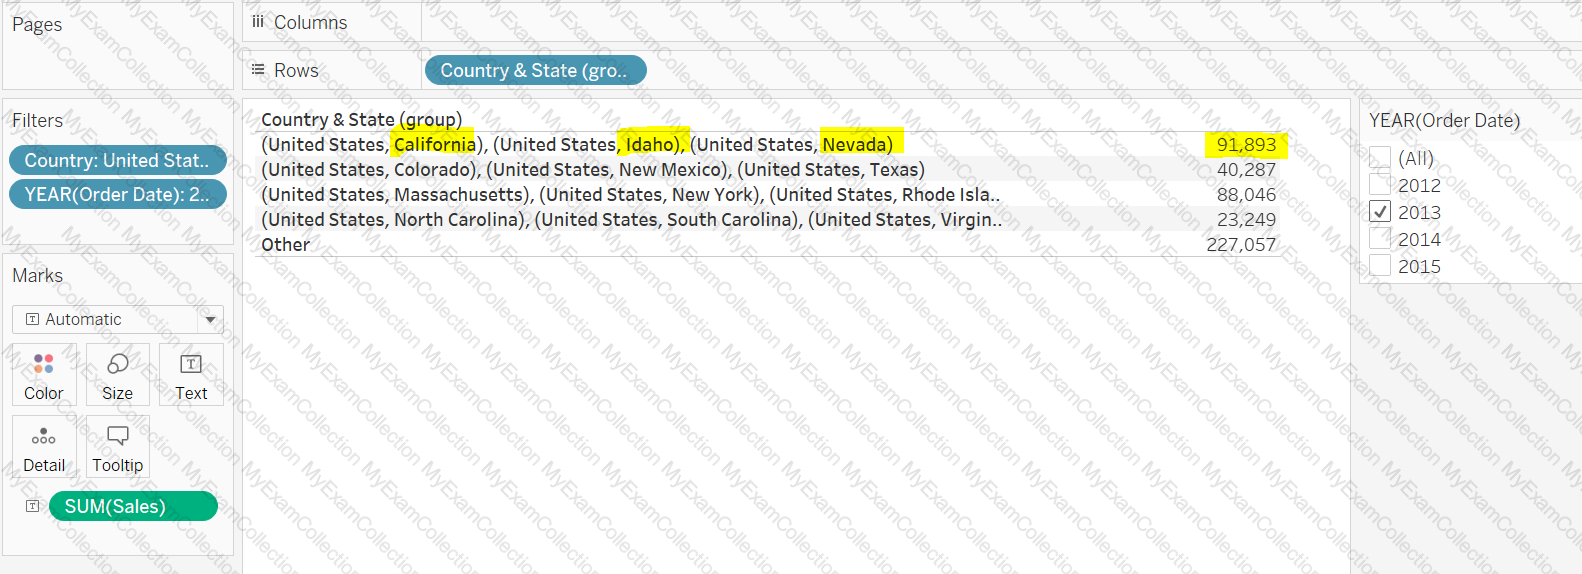 Graphical user interface, text, application
Description automatically generated
Graphical user interface, text, application
Description automatically generated
Question # 9
While creating which of the chart type, we turn off the stack marks from the analysis menu?
Question # 10
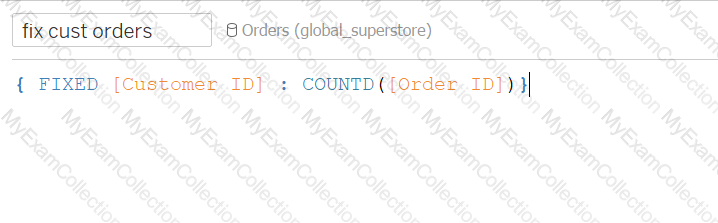
Connect to the "Global Superstore" data source and use the Orders table. Find out how many distinct customers have made 6 orders?
 Graphical user interface, text, application
Description automatically generated
Graphical user interface, text, application
Description automatically generated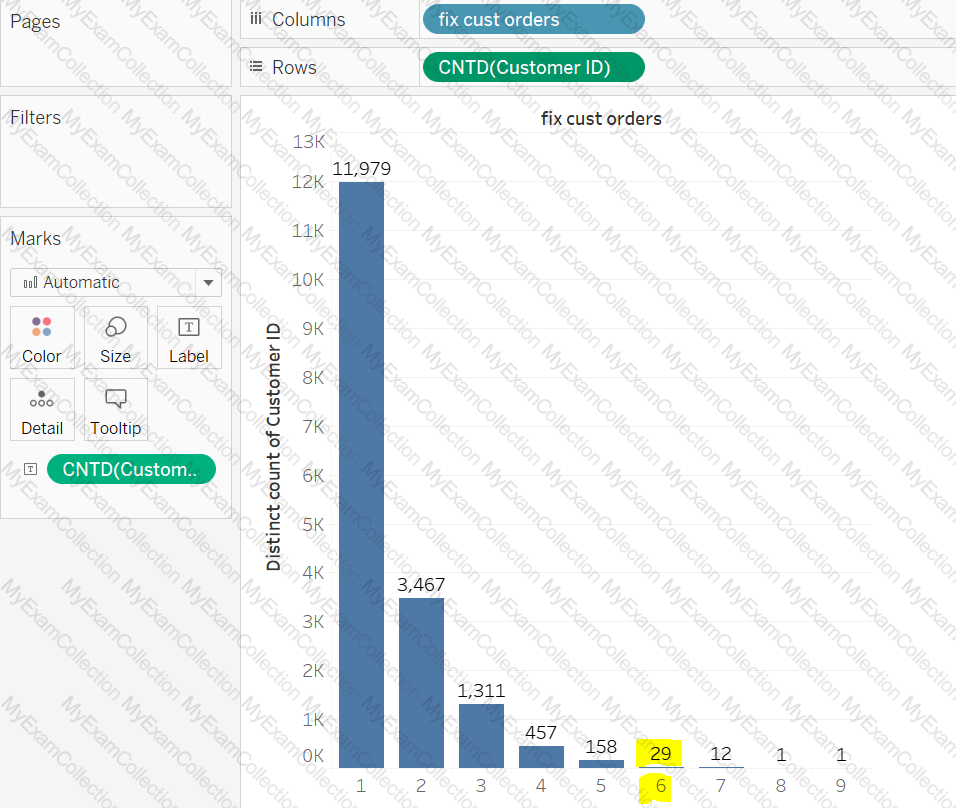 Chart
Description automatically generated
Chart
Description automatically generated
Question # 11
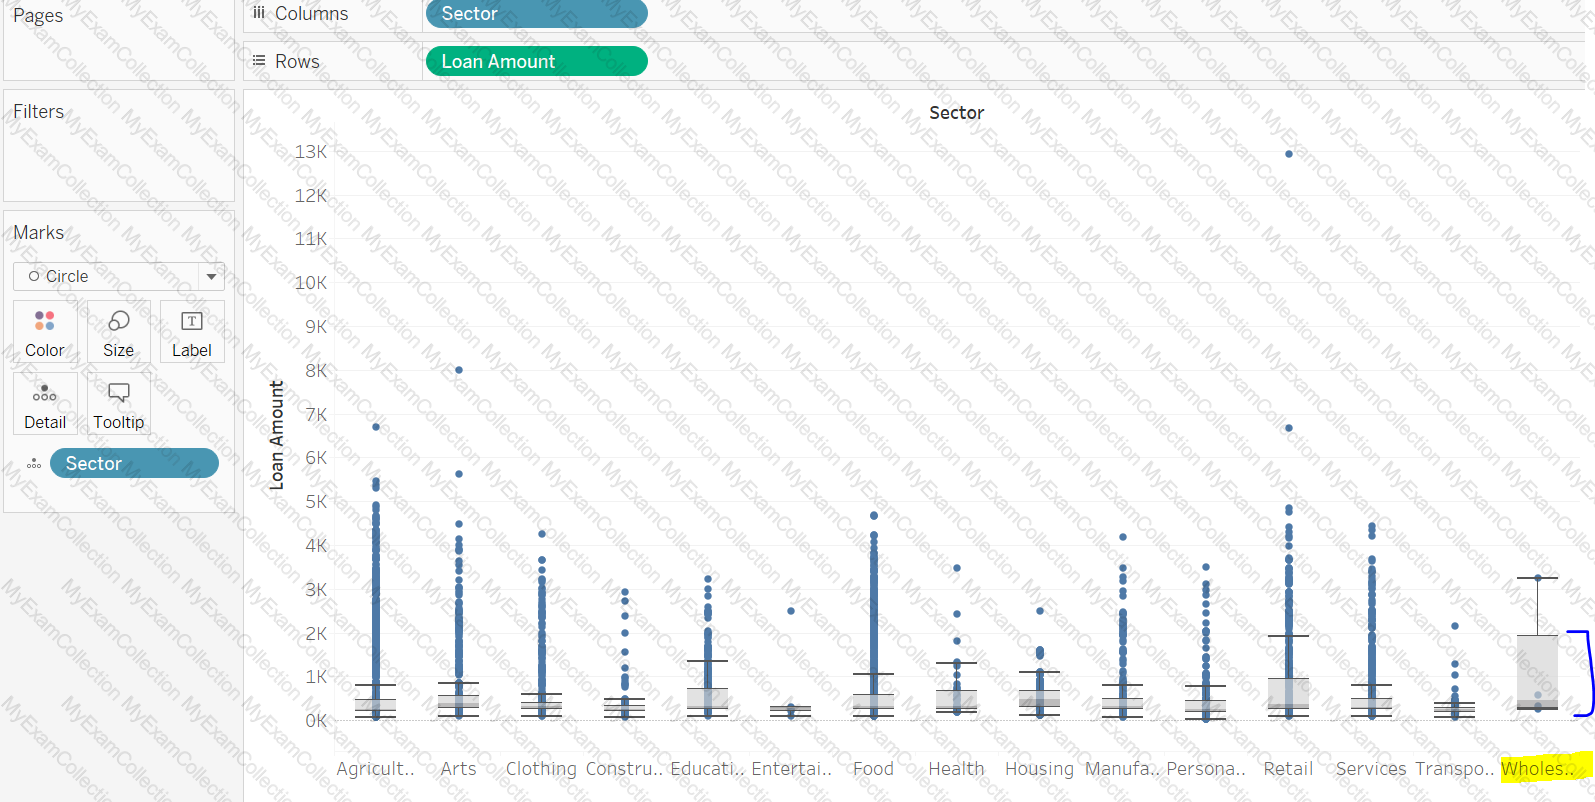
Connect to the "Kiva Loans - India" data source, find out which sector has the highest distribution of loan amount using interquartile ranges?
 Chart, box and whisker chart
Description automatically generated
Chart, box and whisker chart
Description automatically generated
Question # 12
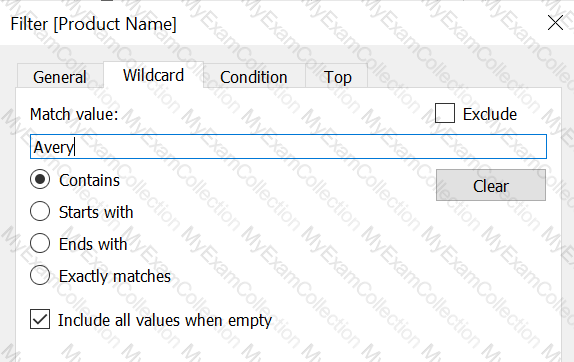
Connect to the "Global Superstore" data source and use the Orders table. Find out the percentage of total sales in all categories by customers who have purchased any product which contains the word 'Avery'?
 Graphical user interface, text, application, email
Description automatically generated
Graphical user interface, text, application, email
Description automatically generated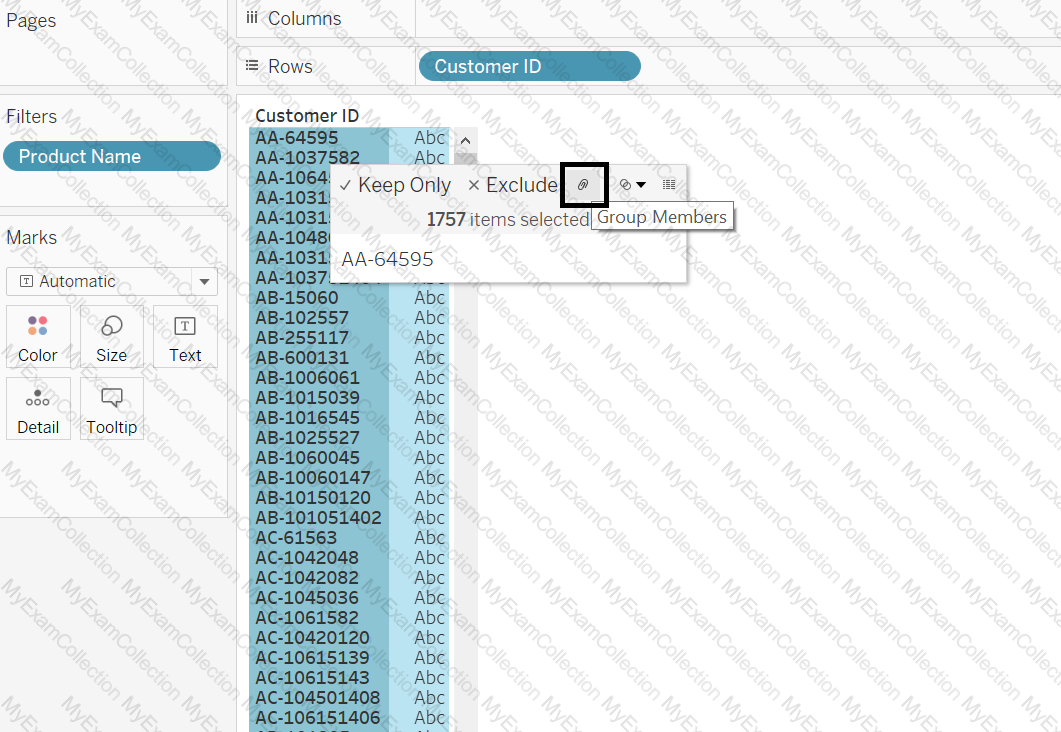 Graphical user interface, text
Description automatically generated
Graphical user interface, text
Description automatically generated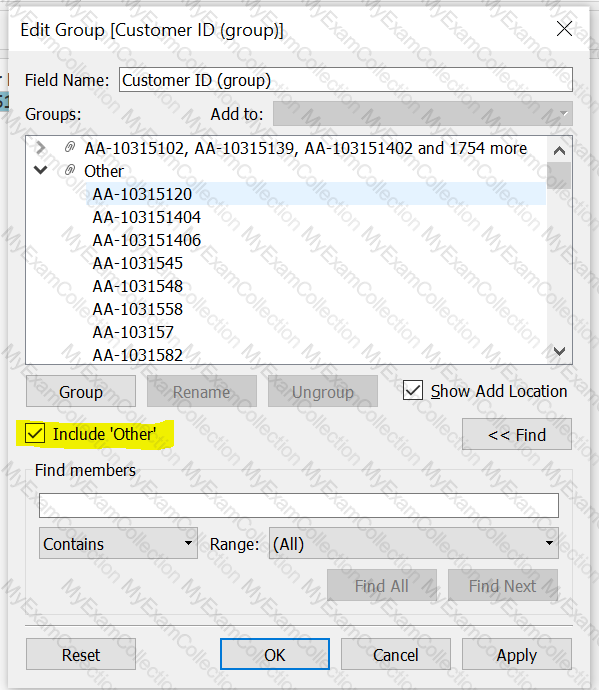 Graphical user interface, text, application
Description automatically generated
Graphical user interface, text, application
Description automatically generated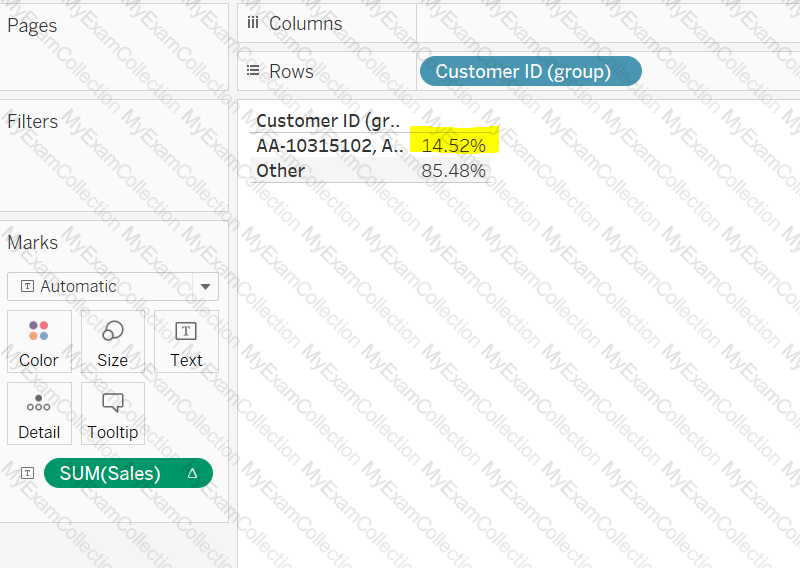 Graphical user interface, text, application, chat or text message
Description automatically generated
Graphical user interface, text, application, chat or text message
Description automatically generated
Question # 13
Which of these chart types are primarily used to compare measures against goals?
Question # 14
Use custom geocoding, when you need ___________ locations to map your data.
Question # 15
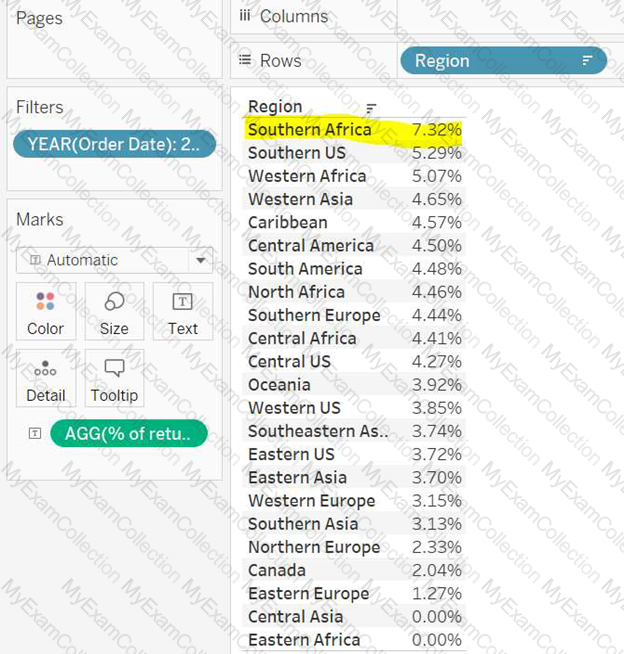
Connect to the "Global Superstore" data source and find out which region was having the highest percentage of returned orders in 2013?