Question # 5
When building a K-means clustering model, you notice that the clusters did not segment on variables that you expected. What should you do?
Question # 9
You have the data from a popular e-commerce website. You are exploring the time spent (in seconds) on the website by 100,000 customers across 14 different product categories.
What visualization can be used to represent the relationship between time spent and product category?
Question # 10
A logistic regression model is built to determine the probability of a credit card borrower defaulting on a credit loan. A threshold value of 0.3 is selected. Which statement can be used to predict a borrower will default?
Question # 11

Refer to the exhibit.
What is the approximate R-squared value for a linear regression model fitted to the data associated with this scatterplot?
Question # 12
After which phase of the data analytics lifecycle should you determine if the model needs any recalibration?
Question # 14
When should you consider using multinomial logistic regression over binary logistic regression?
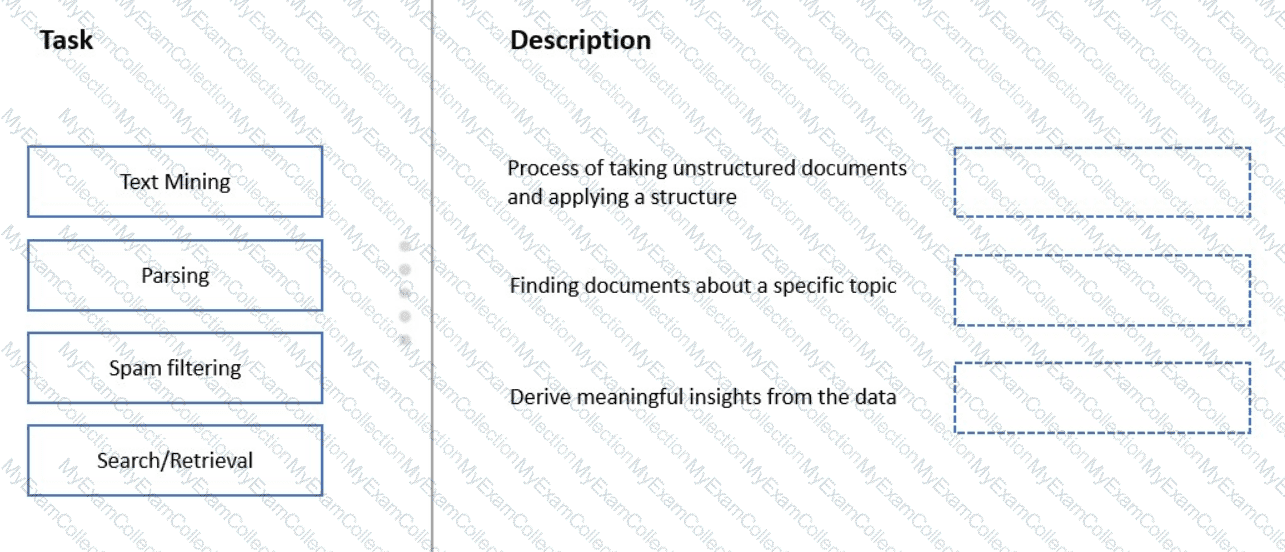
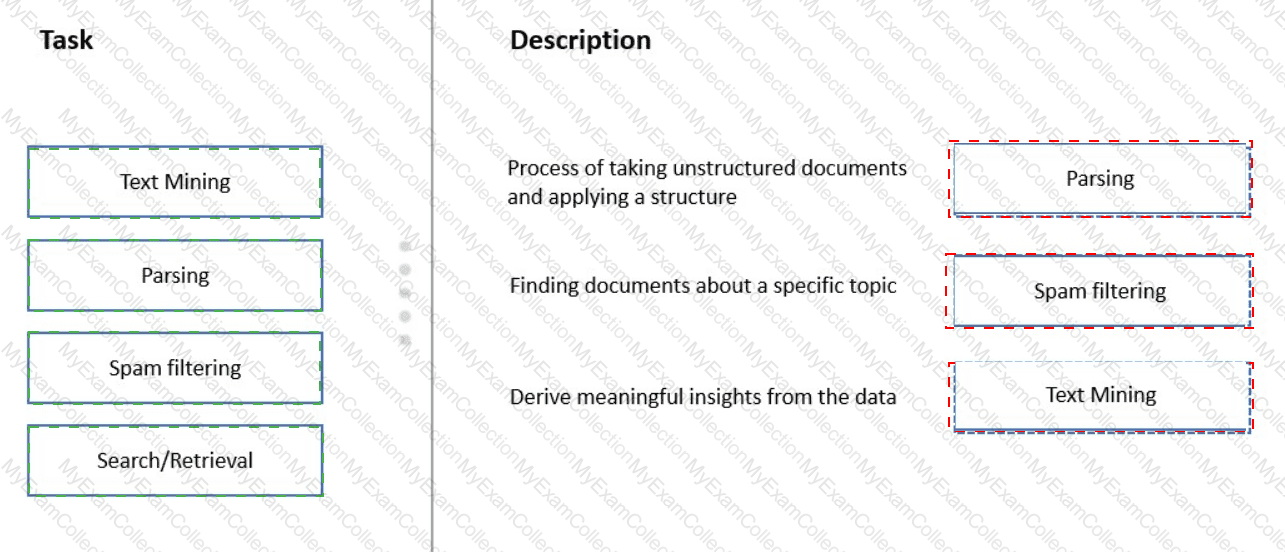
Question # 15
What is the purpose of applying the naïve Bayes conditional independence assumption?
Question # 16
After running a density plot you realize that the data has a long tail to the right. What can you do to make the dataset more normally distributed?