Labour Day Sale - Limited Time 70% Discount Offer - Ends in 0d 00h 00m 00s - Coupon code: mxmas70

Home > GAQM > Lean Six Sigma Black Belt Certification > CLSSBB

CLSSBB Certified Lean Six Sigma Black Belt (CLSSBB) Question and Answers

Question # 4

A population is bimodal with a variance of 5.77. One hundred samples of size 30 are randomly collected and the 100 sample means are calculated. The standard deviation of these sample means is approximately:

A.

5.77

B.

2.40

C.

1.05

D.

0.44

E.

0.19

Full Access
Question # 5

A quality leader who did extensive work with Japanese industry is:

A.

Juran

B.

Ishikawa

C.

Deming

D.

Ohno

E.

Taguchi

F.

all of the above

G.

none of the above

Full Access
Question # 6

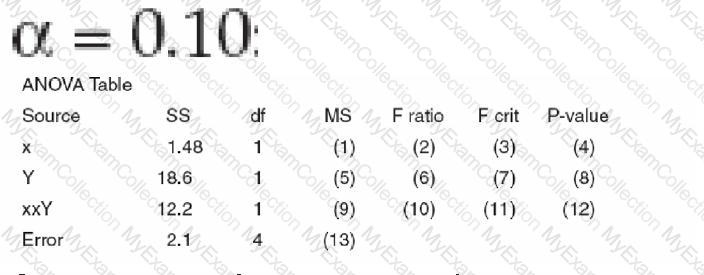
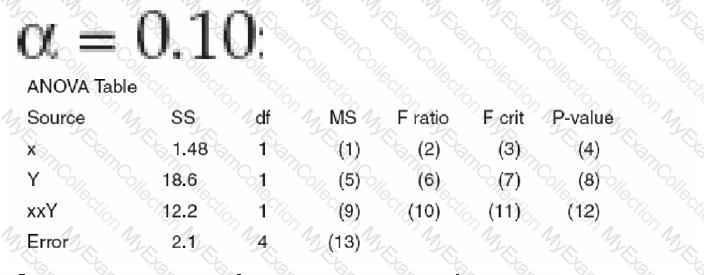
The preferred method for determining statistically whether factor A or B is significant requires what additional information?

A.

value of noise factors

B.

values of responses in replicate runs

C.

number of repetitions

D.

ambient conditions during the experiment

E.

blocking pattern

Full Access
Question # 7

The word “champion” in the context of Six Sigma projects refers to:

A.

the team that has had the most impact on the bottom line

B.

the person who has coordinated teams most effectively

C.

the individual who has outpaced all others in six sigma knowledge

D.

none of the above

Full Access
Question # 8

This table displays the inventory of fasteners in a storage cabinet. An item is selected at random from the fastener cabinet. Find the approximate probability it is size 3/4.

A.

.85

B.

.185

C.

.03

D.

.11

E.

none of the above

Full Access
Question # 9

If DPU = 0.022, the RTU is approximately:

A.

0.022

B.

0.078

C.

0.0022

D.

0.98 E. 0.098

E.

0.0098

Full Access
Question # 10

The leader in the quality movement who recommended that organizations “eliminate numerical quotas for the work force and numerical goals for management”:

A.

Juran

B.

Ishikawa

C.

Crosby

D.

Feigenbaum

E.

Taguchi

F.

none of the above

Full Access
Question # 11

The team in the above problem draws arrows from Post-It® notes that are causes to notes that are the effects of these causes. This step is best described by which approach to problem solving?

A.

Affinity diagram

B.

Inter-relationship digraph

C.

Tree diagram

D.

Process decision program chart

E.

Matrix diagram

F.

Prioritization matrix

G.

Activity network diagram

Full Access
Question # 12

This table displays the inventory of fasteners in a storage cabinet. An item is selected at random from the fastener cabinet.

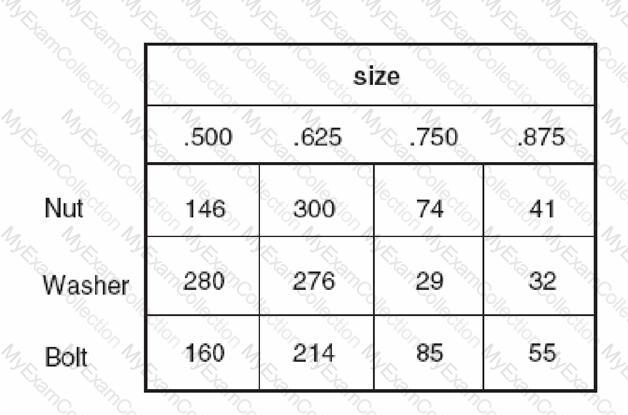
Find the approximate probability it is larger than 1/2.

A.

.35

B.

.65

C.

.1106

D.

.47

E.

none of the above

Full Access
Question # 13

Find the value of (7) in the ANOVA table. Assume:

A.

16.4

B.

3.2

C.

18.6

D.

23.2

E.

4.54

F.

12.2

G.

0.525

Full Access
Question # 14

The quality leader responsible for the term Total Quality Management (TQM):

A.

Juran

B.

Ishikawa

C.

Crosby

D.

Feigenbaum

E.

Taguchi

F.

none of the above

Full Access
Question # 15

Find Cp and Cpk.

A.

1.21 and .85

B.

.85 and 1.21

C.

.35 and .63

D.

.63 and .42

E.

none of the above

Full Access
Question # 16

A random sample of 2500 printed brochures is found to have a total of three ink splotches. The rate of ink splotches in PPM is:

A.

1,000,000 ÷ 2500 × 3

B.

2500 ÷ 1,000,000 × 3

C.

3 ÷ 2500 × 1,000,000

D.

3 × 2500 ÷ 1,000,000

Full Access
Question # 17

If the probability that event A occurs is 0.51, the probability that event B occurs is 0.64 and that probability that both A and B occur is 0.23 then:

A.

events A and B are complementary

B.

events A and B are mutually exclusive

C.

events A and B are supplementary

D.

events A and B are not mutually exclusive

E.

events A and B are statistically independent

Full Access
Question # 18

Perform a risk analysis to determine the expected profit or (loss) from a project which has four possible disjoint outcomes:

Outcome A shows a profit of $340,000 and has a probability of 0.25.

Outcome B shows a profit of $120,000 and has a probability of 0.40.

Outcome C shows a loss of $40,000 and has a probability of 0.10.

Outcome D shows a profit of $100,000 and has a probability of 0.25.

A.

$130,000

B.

$520,000

C.

$154,000

D.

($168,000)

E.

none of the above

Full Access
Question # 19

SCENARIO

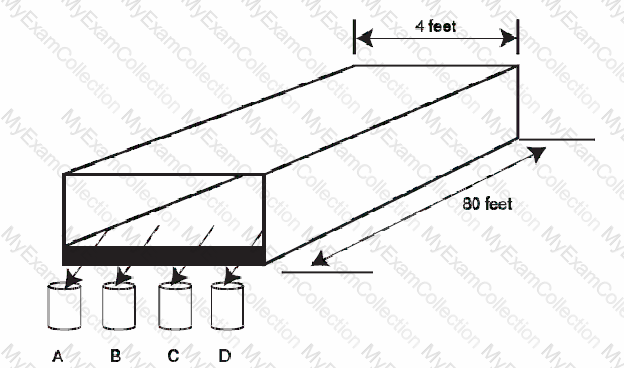
A Six Sigma team is measuring the moisture content of corn starch as it leaves the conveyer belt of a dryer. They collect one sample four cups of starch at times indicated in the chart at fixed locations labeled A, B, C, and D across the end of the belt. See the diagram below.

After some more work on the dryer, additional data are collected which when plotted looks like this:

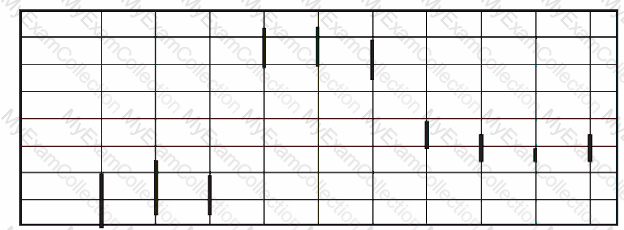
Which type of variation dominates?

A.

within sample

B.

sample to sample within the hour

C.

hour to hour

D.

none of the above

Full Access
Question # 20

A team is investigating ways to reduce power outages. They determine that an outage can occur in only three ways: grid failure, local transformer failure or local overload. They then investigate each of these three events for possible causes, etc. They draw a diagram that “fans out” using the power outage as the handle of the fan.

These improvements are best described by which approach to problem solving?

A.

Affinity diagram

B.

Inter-relationship digraph

C.

Tree diagram

D.

Process decision program chart

E.

Matrix diagram F. Prioritization matrix

F.

Activity network diagram

Full Access
Question # 21

There are 14 different defects that can occur on a completed time card. The payroll department collects 328 cards and finds a total of 87 defects. DPMO =:

A.

87 ÷ 328

B.

87 ÷ (328 × 14)

C.

14 ÷ 87

D.

87 ÷ 14 × 1,000,000

E.

328 ÷ 87

F.

87 × 1,000,000 ÷ (14 × 328)

Full Access
Question # 22

A team wants a technique for doing an initial study of a process that not every team member is familiar with. They should use:

A.

written and diagrammed work instructions

B.

flow charts and process maps

C.

cause and effect diagrams

D.

Pareto chart

E.

relationship matrix

Full Access
Question # 23

Find the value of (6) in the ANOVA table. Assume:

A.

16.4

B.

3.2

C.

18.6

D.

23.2

E.

4.54

F.

12.2

G.

0.525

Full Access
Question # 24

This experimental design is an example of:

A.

full factorial

B.

half fractional factorial

C.

fractional factorial

D.

ANOVA design

Full Access
Question # 25

A project that lacks a clear definition of its scope and boundaries runs the risk of:

A.

straying from the intended path

B.

trying to solve unrelated problems

C.

having difficulty in collecting baseline data

D.

suffering morale problems

E.

all the above

F.

none of the above

Full Access
Question # 26

A team wants a technique for displaying the connection between various customer needs and various features on a product. They should use:

A.

written and diagrammed work instructions

B.

flow charts and process maps

C.

cause and effect diagrams

D.

Pareto chart

E.

relationship matrix

Full Access
Question # 27

This table displays the inventory of fasteners in a storage cabinet. A bolt is selected at random from the fastener cabinet. Find the approximate probability it is size 7/8.

A.

11

B.

.08

C.

.09

D.

.30

E.

none of the above

Full Access
Question # 28

Which of the following tools would be most appropriate for collecting data to study the symptoms of a problem?

A.

Check sheet

B.

Flow diagram

C.

Force-field analysis

D.

Activity network diagram

Full Access
Question # 29

__________________can be measured against a benchmark in a process.

A.

Performance

B.

Outcome of the process

C.

Operational Efficiency

D.

All of the above

Full Access
Question # 30

A six sigma team has been chartered to improve the way in which a company takes orders for its products. Which of the following tools should the team use to determine all of the potential pitfalls and the actual defects that occur?

A.

Process failure mode and effects analysis

B.

Process map

C.

Design for six sigma

D.

Supplier input process output control

Full Access
Question # 31

A six sigma team has been formed to improve an existing process. Which of the following tools should the team use first to gain a clear understanding of the current process?

A.

Flowchart

B.

Pareto chart

C.

Process FMEA

D.

Latin square DOE

Full Access
Question # 32

A process shows the following number of defectives. Each sample size for this process is

85.3 8 2 7 7 6 8 8 9 5.

What control chart should be used?

A.

x-bar and R

B.

median

C.

individual and moving range

D.

p

E.

np

F.

c

G.

u

Full Access
Question # 33

Which of the following measures is increased when process performance is improved?

A.

Variability range

B.

Capability index

C.

Repeatability index

D.

Specification limits

Full Access
Question # 34

An example of a project metric would be:

A.

the decrease in defect occurrence

B.

the decrease in product cost

C.

the decrease in cycle time

D.

all the above

Full Access
Question # 35

A newspaper article describes a high positive correlation between obesity and orange juice consumption among six-year-olds. Parents who restrict the use of orange juice for their children have:

A.

made a type I error

B.

made a type II error

C.

misunderstood margin of error

D.

confused correlation with causation

Full Access
Question # 36

A six sigma project to reduce billing statement expenses has shown the need to hire two additional mailroom clerks. Based on this information, which of the following metrics should be used to measure the financial benefits of the project?

A.

Cost of poor quality

B.

Return on investment

C.

Net present value

D.

Internal rate of return

Full Access
Question # 37

Typically, which of the following activities is done earliest in the formation of a project team?

A.

Select the team

B.

Identify the objective

C.

Identify the sponsor

D.

Allocate the resources

Full Access
Question # 38

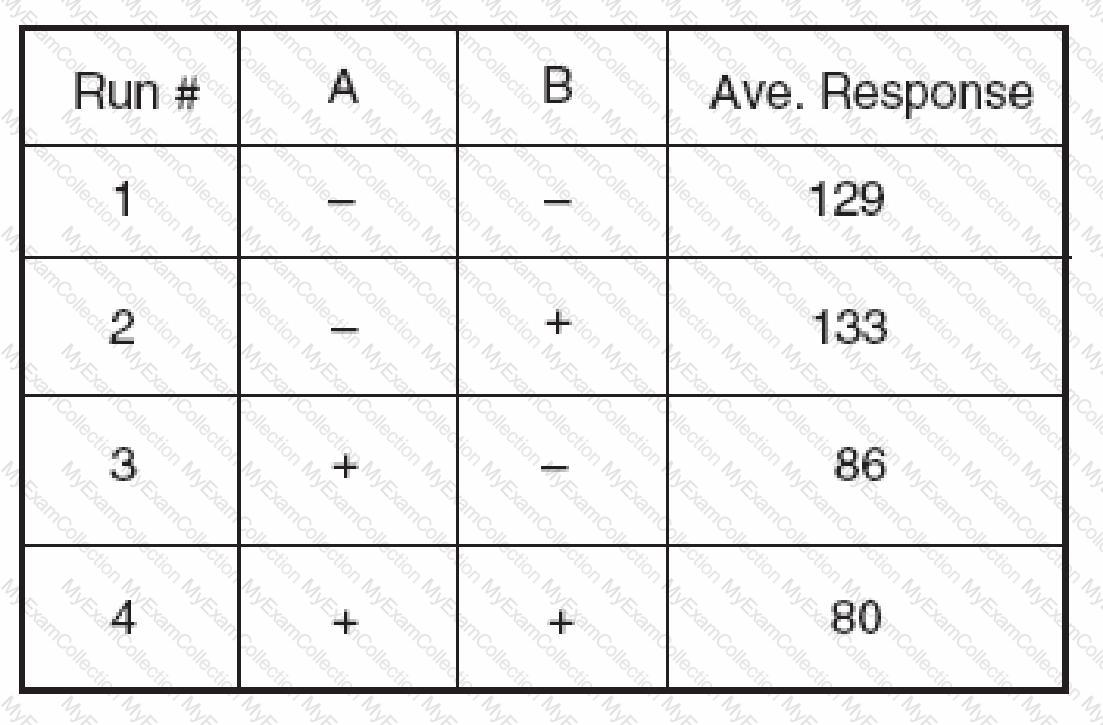
If it is desirable to maximize the response R, the following levels should be used:

A.

A+ and B+

B.

A+ and B–

C.

A– and B+

D.

A– and B–

E.

none of the above

Full Access
Question # 39

You are a Project Manager wanting to compare on time delivery (%) of Team Leads across 4 teams, your choice of technique would be?

A.

Hypothesis Testing

B.

Histograms

C.

Pareto chart

D.

Box Plots

Full Access
Question # 40

Which of the following tools is commonly used in the define phase of a project?

A.

Affinity diagram

B.

Control chart

C.

Failure mode and effects analysis

D.

Data collection checklist

Full Access
Question # 41

Which of the following is NOT an advantage of using a median?

A.

Extreme values do not affect the median as strongly as they affect Mean

B.

A median can be calculated for qualitative descriptions

C.

Median is easy to understand

D.

Median can be calculated even for open-ended classes

Full Access
Question # 42

An x-bar and R chart has four part measurements per sample. The control limits on the averages chart are 2.996 and 3.256. Assume the process data form a normal distribution. What is the probability that the next plotted point falls outside the control limits?

A.

0.00135

B.

0.0027

C.

0.0054

D.

none of the above

Full Access
Question # 43

In Control chart interpretations, how many business rules (Shewart Rule's) will be used to interpret for stable process?

A.

5 Rules

B.

7 Rules

C.

6 Rules

D.

8 Rules

Full Access
Question # 44

Find the value of b or b0:

A.

3.33

B.

–3.33

C.

4.08

D.

–4.08

E.

1.24

F.

–1.24

Full Access
Question # 45

Which of the following activities is value-added?

A.

Setup

B.

Process

C.

Storage

D.

Inspection

Full Access
Question # 46

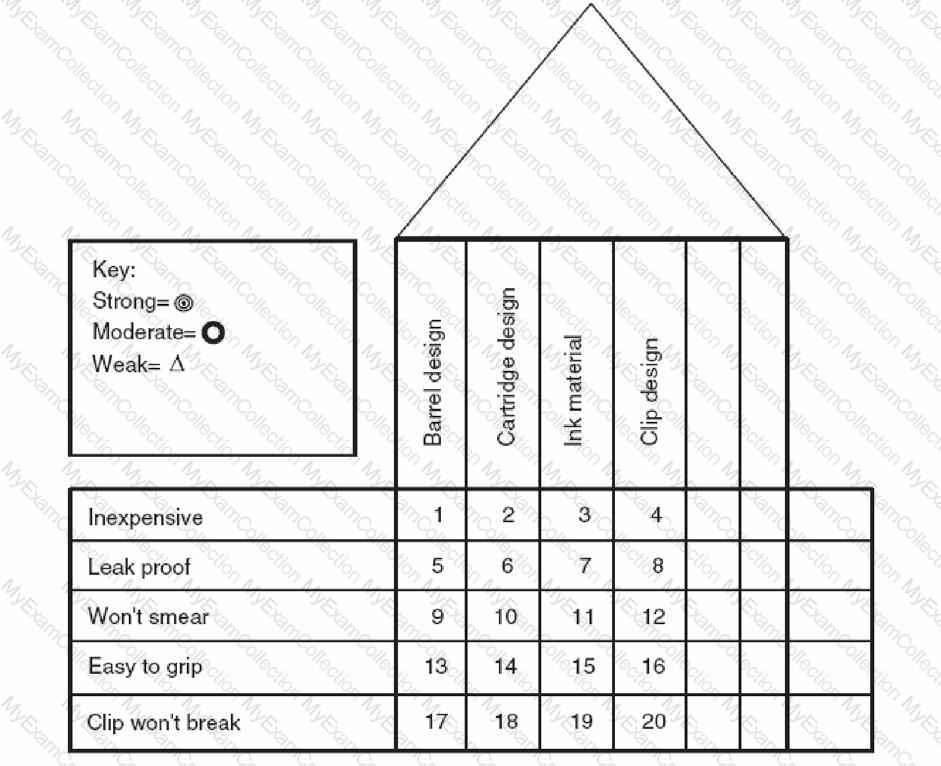
This QFD matrix was used in the design process for a ball point pen. What symbol is appropriate for the square labeled 13?

A.

B.

C.

D.

none of the above

Full Access
Question # 47

Typically, which of the following actions is NOT used to reduce process cycle time?

A.

Analyzing current processes

B.

Reducing queue times

C.

Setting scheduling priorities

D.

Implementing activity-based costing

Full Access
Question # 48

The word takt is closest to the theory of constraints word:

A.

drum

B.

buffer

C.

rope

D.

constraint

Full Access
Question # 49

In measurement system analysis, which of the following pairs of data measures is used to determine total variance?

A.

Process variance and reproducibility

B.

Noise system and repeatability

C.

Measurement variance and process variance

D.

System variance and bias

Full Access
Question # 50

When σ = 10, what sample size is needed to specify a 95% confidence interval of ±3 units from the mean?

A.

7

B.

11

C.

32

D.

43

Full Access
Question # 51

A and B are events. P(A) = 0.80 and P(B) = 0.90

A.

events A and B are disjoint or mutually exclusive

B.

events A and B are not disjoint or mutually exclusive C. P(A and B) = 0 D. P(A and B) = 1.7

Full Access
Question # 52

A process shows the following number of defects. Each sample size for this process is

85. 3 8 2 7 7 6 8 8 9 5.

What control chart should be used?

A.

x-bar and R

B.

median

C.

individual and moving range

D.

p

E.

np

F.

c

G.

u

Full Access
Question # 53

Correction, over-production, inventory, and motion are all examples of

A.

waste

B.

5S target areas

C.

Noise

D.

value-added activities

Full Access