Question # 4
A client is considering migrating from Tableau Server to Tableau Cloud.
Which two elements are determining factors of whether the client should use Tableau Server or Tableau Cloud? Choose two.
Question # 5
An executive-level workbook leverages 37 of the 103 fields included in a data source. Performance for the workbook is noticeably slower than other workbooks
on the same Tableau Server.
What should the consultant do to improve performance of this workbook while following best practice?
Question # 6
A client wants to provide sales users with the ability to perform the following tasks:
· Access published visualizations and published data sources outside the company network.
· Edit existing visualizations.
· Create new visualizations based on published data sources.
. Minimize licensing costs.
Which site role should the client assign to the sales users?
Question # 7
A client uses Tableau Data Management and notices that when they view a data source, they sometimes see a different count of workbooks in the Connected
Workbooks tab compared to the lineage count in Tableau Catalog.
What is the cause of this discrepancy?
Question # 8
During a Tableau Cloud implementation, a Tableau consultant has been tasked with implementing row-level security (RLS). They have already invested in implementing RLS within their own database for their legacy reporting solution. The client wants to know if they will be able to leverage their existing RLS after the Tableau Cloud implementation.
Which two requirements should the Tableau consultant share with the client? Choose two.
Question # 9
A stakeholder has multiple files saved (CSV/Tables) in a single location. A few files from the location are required for analysis. Data transformation (calculations)
is required for the files before designing the visuals. The files have the following attributes:
. All files have the same schema.
. Multiple files have something in common among their file names.
. Each file has a unique key column.
Which data transformation strategy should the consultant use to deliver the best optimized result?
Question # 10
A client wants to see data for only the last day in a dataset and the last day is always yesterday. The date is represented with the field Ship Date.
The client is not concerned about the daily refresh results. The volume of data is so large that performance is their priority. In the future, the client will be able
to move the calculation to the underlying database, but not at this time.
The solution should offer the best performance.
Which approach should the consultant use to produce the desired results?
Question # 11
A client has a pipeline dashboard that takes a long time to load. The dashboard is connected to only one large data source that is an extract.
It contains two calculated fields:
. TOTAL([Opportunities])
· SUM([Value])
It also contains two filters:
. A Relative Date filter on Created Date, a Date field containing values from 5 years ago until today
. A Multiple Values (Dropdown) filter on Account Name, a String field containing 1,000 distinct values
A consultant creates a Performance Recording to troubleshoot the issue, and finds out that the longest-running event is "Executing Query."
Which step should the consultant take to resolve this issue?
Question # 12
A client is searching for ways to curate and document data in order to obtain data lineage. The client has a data source connected to a data lake.
Which tool should the consultant recommend to meet the client's requirements?
Question # 13
A university has data on its undergraduate students and their majors by grade level (Freshman, Sophomore, Junior, Senior). The university is interested in
visualizing the path students take as they change majors across grade levels.
Which visualization type should the consultant recommend?
Question # 14
A client requests a published Tableau data source that is connected to SQL Server. The client needs to leverage the multiple tables option to create an
extract. The extract will include partial data from the SQL Server data source.
Which action will reduce the amount of data in the extract?
Question # 15
A client wants to use a bar chart to visualize the trend in profit per quarter for the last 5 years. They want each bar's color to be determined by whether the profit during that quarter was greater than the median profit for the past four quarters, including the current quarter.
For example, if a bar represents profit for 2020 Q4, they want to visually see whether the profit for 2020 Q4 is greater than the median profit for 2020 Q1–2020 Q4.
Which table calculation should produce the desired result?
Question # 16
Sales managers use a daily extract from Snowflake to see the previous day’s snapshot.
Sales managers should only see statistics for their direct reports.
The company has Tableau Data Management on Tableau Cloud.
A consultant must design a centralized, low-maintenance RLS strategy.
What should the consultant implement?
Question # 17
A client currently has a workbook with the table shown below.
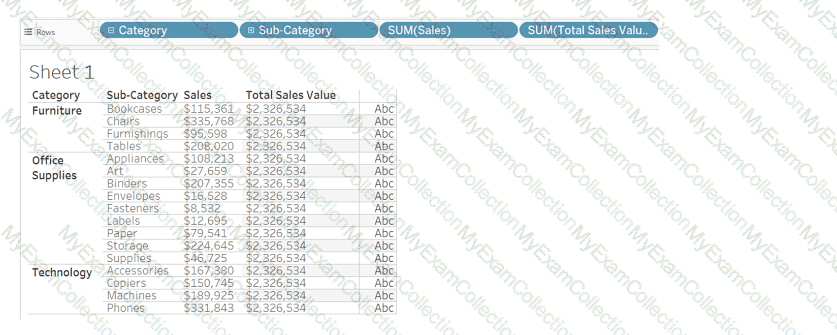
Which method will produce the output for the Total Sales Value field for all the categories shown in the table?
Question # 18
A client calculates the percent of total sales for a particular region compared to all regions.
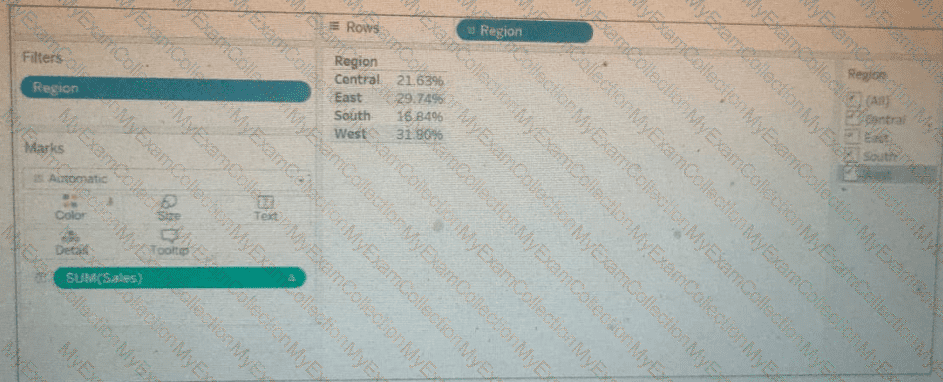
The Sales percentage is inadvertently recalculated each time the filter is applied to the Region.
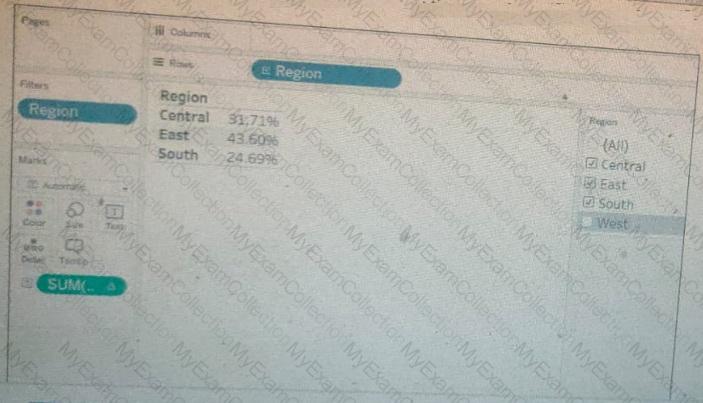
Which calculation should fix the automatic recalculation on the % of total field?
Question # 19
A new Tableau user created a simple dashboard on Tableau Server using supply chain data. Now, the user wants to know if they created the dashboard in
accordance with specific performance best practices.
Which approach should the consultant recommend for the client to make this determination?
Question # 20
A client collects information about a web browser customers use to access their website. They then visualize the breakdown of web traffic by browser version.
The data is stored in the format shown below in the related table, with a NULL BrowserID stored in the Site Visitor Table if an unknown browser version
accesses their website.
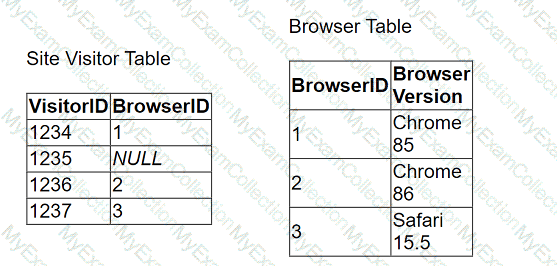
The client uses "Some Records Match" for the Referential Integrity setting because a match is not guaranteed. The client wants to improve the performance of
the dashboard while also getting an accurate count of site visitors.
Which modifications to the data tables and join should the consultant recommend?
Question # 21
From the desktop, open the CC workbook.
Open the Manufacturers worksheet.
The Manufacturers worksheet is used to
analyze the quantity of items contributed by
each manufacturer.
You need to modify the Percent
Contribution calculated field to use a Level
of Detail (LOD) expression that calculates
the percentage contribution of each
manufacturer to the total quantity.
Enter the percentage for Newell to the
nearest hundredth of a percent into the
Newell % Contribution parameter.
From the File menu in Tableau Desktop, click
Save.
Question # 22
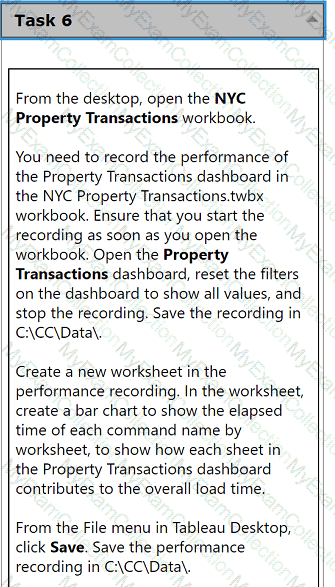
From the desktop, open the NYC
Property Transactions workbook.
You need to record the performance of
the Property Transactions dashboard in
the NYC Property Transactions.twbx
workbook. Ensure that you start the
recording as soon as you open the
workbook. Open the Property
Transactions dashboard, reset the filters
on the dashboard to show all values, and
stop the recording. Save the recording in
C:\CC\Data\.
Create a new worksheet in the
performance recording. In the worksheet,
create a bar chart to show the elapsed
time of each command name by
worksheet, to show how each sheet in
the Property Transactions dashboard
contributes to the overall load time.
From the File menu in Tableau Desktop,
click Save. Save the performance
recording in C:\CC\Data\.
Question # 23
From the desktop, open the CC workbook.
Open the Incremental worksheet.
You need to add a line to the chart that
shows the cumulative percentage of sales
contributed by each product to the
incremental sales.
From the File menu in Tableau Desktop, click
Save.
Question # 24
Use the following login credentials to sign in
to the virtual machine:
Username: Admin
Password:
The following information is for technical
support purposes only:
Lab Instance: 40201223
To access Tableau Help, you can open the
Help.pdf file on the desktop.
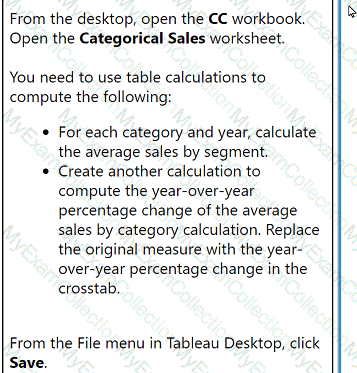
From the desktop, open the CC workbook.
Open the Categorical Sales worksheet.
You need to use table calculations to
compute the following:
. For each category and year, calculate
the average sales by segment.
. Create another calculation to
compute the year-over-year
percentage change of the average
sales by category calculation. Replace
the original measure with the year-
over-year percentage change in the
crosstab.
From the File menu in Tableau Desktop, click
Save.
Question # 25
From the desktop, open the CC workbook. Use the US Population Estimates data source.
You need to shape the data in US Population Estimates by using Tableau Desktop. The data must be formatted as shown in the following table.
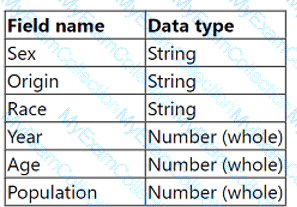
Open the Population worksheet. Enter the total number of records contained in the data set into the Total Records parameter.
From the File menu in Tableau Desktop, click Save.
Question # 26
From the desktop, open the CC workbook.
Open the City Pareto worksheet.
You need to complete the Pareto chart to show the percentage of sales compared to the percentage of cities. The chart must show references lines to visualize how the data compares to the Pareto principle.
From the File menu in Tableau Desktop, click Save.