Question # 4
While building a predictive model, median imputations are performed while preparing the training data.
How should the imputations be addressed in the validation data?
Question # 5
Refer to the exhibit:
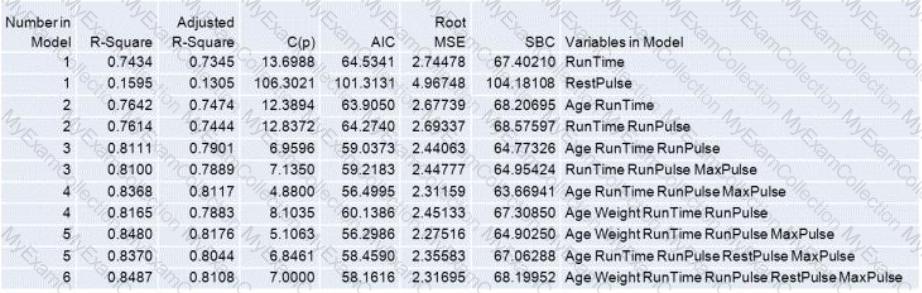
SAS output from the RSQUARE selection method, within the REG procedure, is shown. The top two models in each subset are given.
Based on the AIC statistic, which model is the champion model?
Question # 6
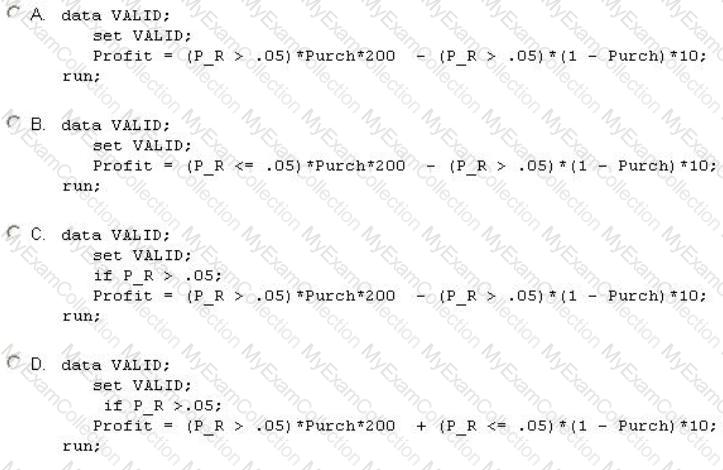
Assume a $10 cost for soliciting a non-responder and a $200 profit for soliciting a responder. The logistic regression model gives a probability score named P_R on a SAS data set called VALID. The VALID data set contains the responder variable Pinch, a 1/0 variable coded as 1 for responder. Customers will be solicited when their probability score is more than 0.05.
Which SAS program computes the profit for each customer in the data set VALID?
Question # 7
Refer to the confusion matrix:
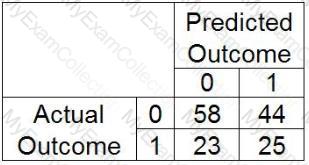
Calculate the accuracy and error rate (0 - negative outcome, 1 - positive outcome)
Question # 8
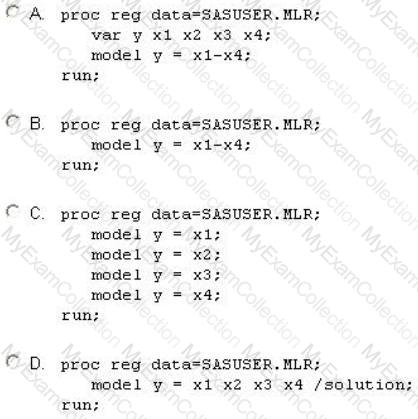
Identify the correct SAS program for fitting a multiple linear regression model with dependent variable (y) and four predictor variables (x1-x4).
Question # 9
Refer to the following odds ratio table:
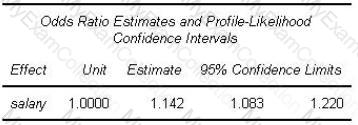
What is a correct interpretation of the estimate?
Question # 11
This question will ask you to provide a missing option.
Given the following SAS program:
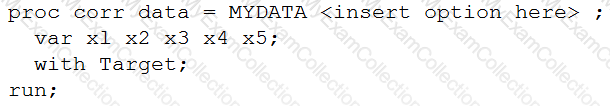
What option must be added to the program to obtain a data set containing Spearman statistics?
Question # 12
Spearman statistics in the CORR procedure are useful for screening for irrelevant variables by investigating the association between which function of the input variables?
Question # 13
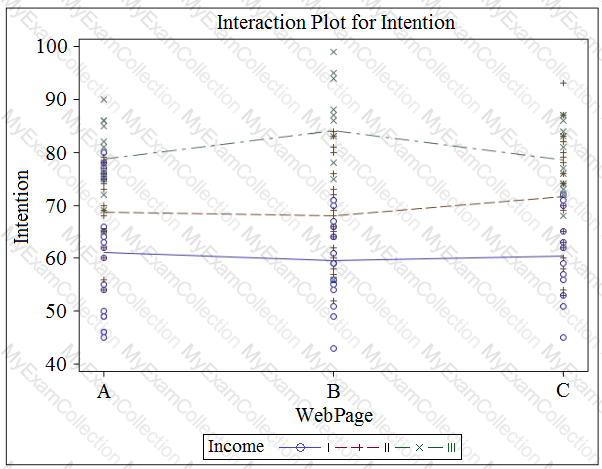
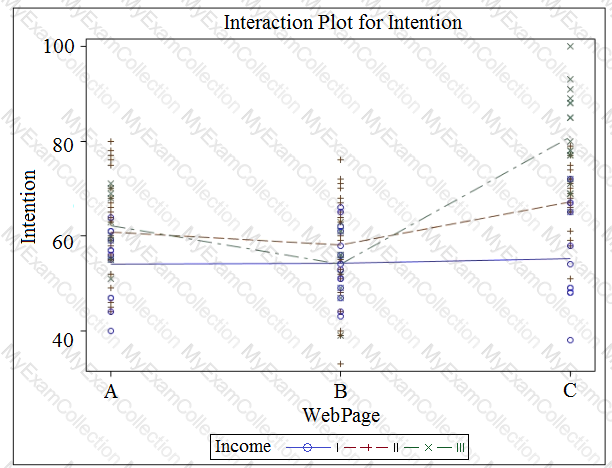
A marketing analyst assessed the effect of web page design (A, B, or C) on customers' intent to purchase an expensive product. The focus group was divided randomly into three sub-groups, each of which was asked to view one of the web pages and then give their intent to purchase on a scale from 0 to 100. The analyst also asked the customers to give their income, which was coded as: I (lowest), II (medium), or III (highest). After analyzing the data, the analyst claimed that there was significant interaction and the webpage design mainly influenced high income people.
Which graph supports the analyst's conclusion?
A)
B)
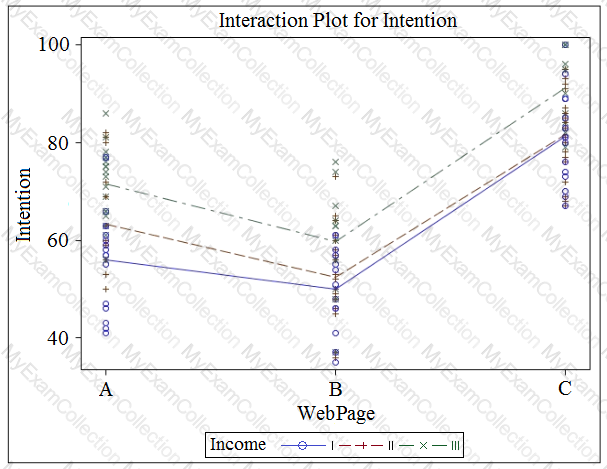
C)
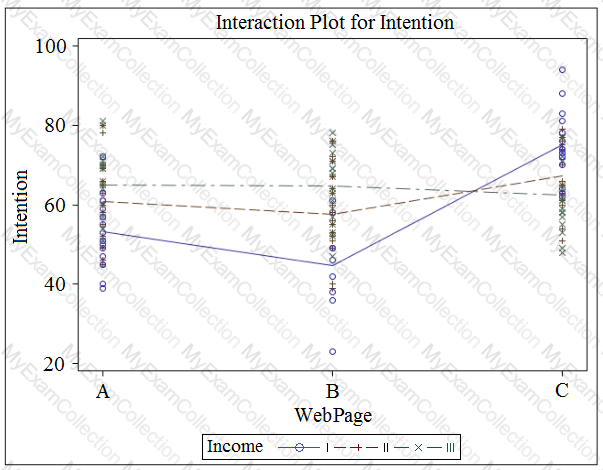
D)
Question # 14
What is a drawback to performing data cleansing (imputation, transformations, etc.) on raw data prior to partitioning the data for honest assessment as opposed to performing the data cleansing after partitioning the data?