Question # 4
You need to configure access for the sales department users. The solution must me meet the security requirements. What should you do?
Question # 5
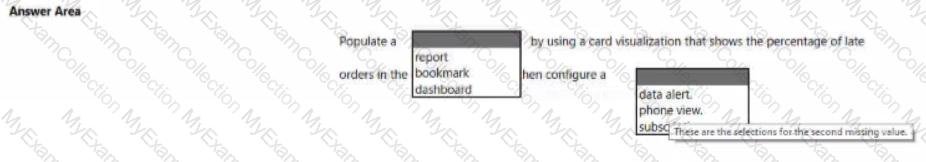
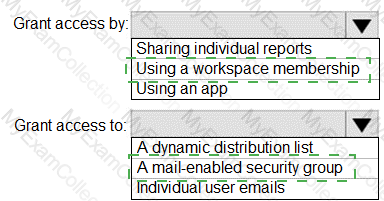
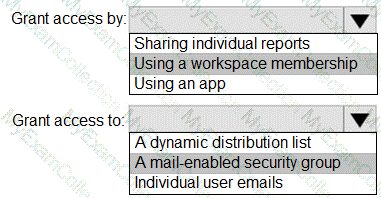
You need to create a solution to meet the notification requirements of the warehouse shipping department.
What should you do? To answer, select the appropriate options in the answer area.
NOTE: Each correct select is worth one point:

Question # 6
Your organization has a team of power users who recently created 20 Power BI dashboards.
The power users share the dashboards with other users in the organization.
When the users attempt to access the dashboards, they receive the error message shown in the exhibit. (Click the Exhibit.)
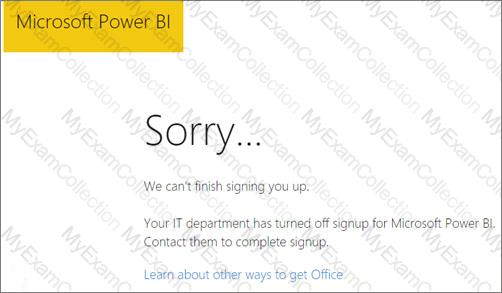
You need to ensure that all the users can access the dashboards.
What should you do first?
Question # 7
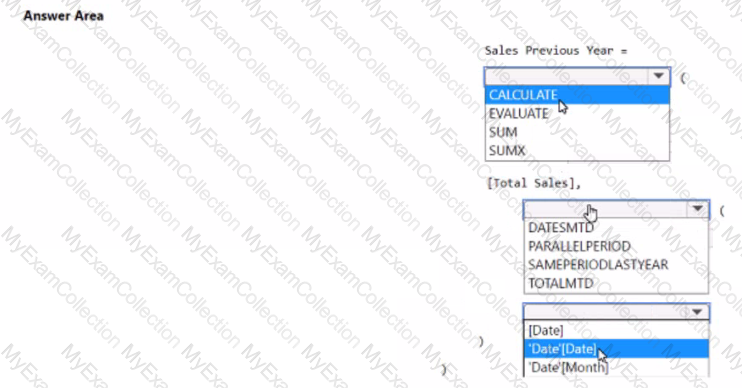
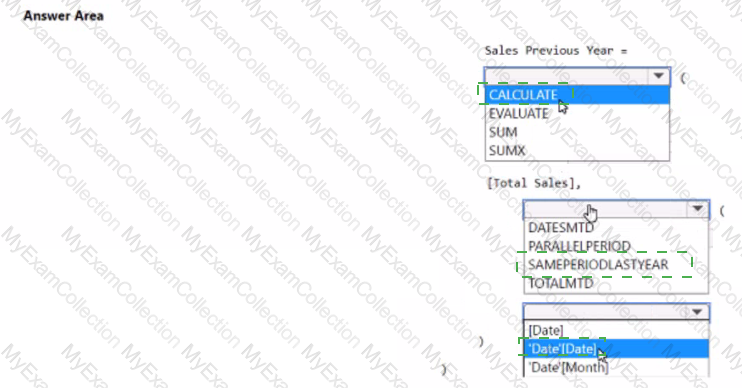
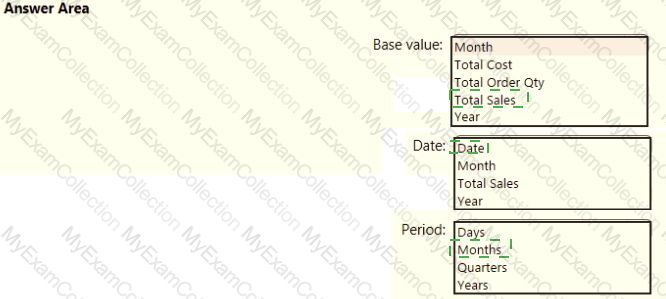
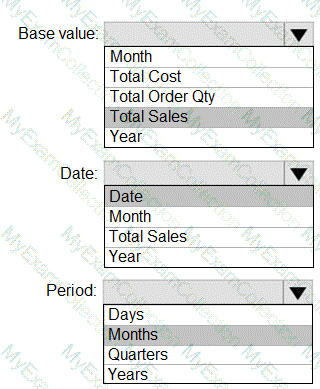
You have a Power BI model that contains a table named Sales and a related date table. Sales contains a measure named Total Sales You need to create a measure that calculates the total sales from the equivalent month of the previous year.
How should you complete the calculation? To answer, select the appropriate options in the answer area
NOTE: Each correct selection is worth one point.
Question # 8
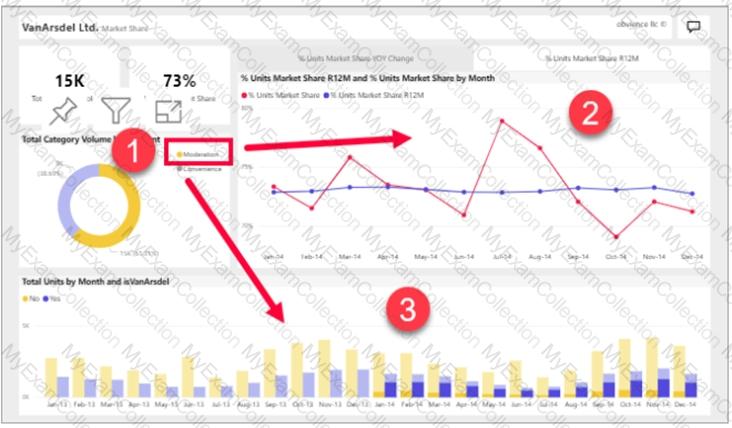
You have a report page that contains the visuals shown in the following exhibit.
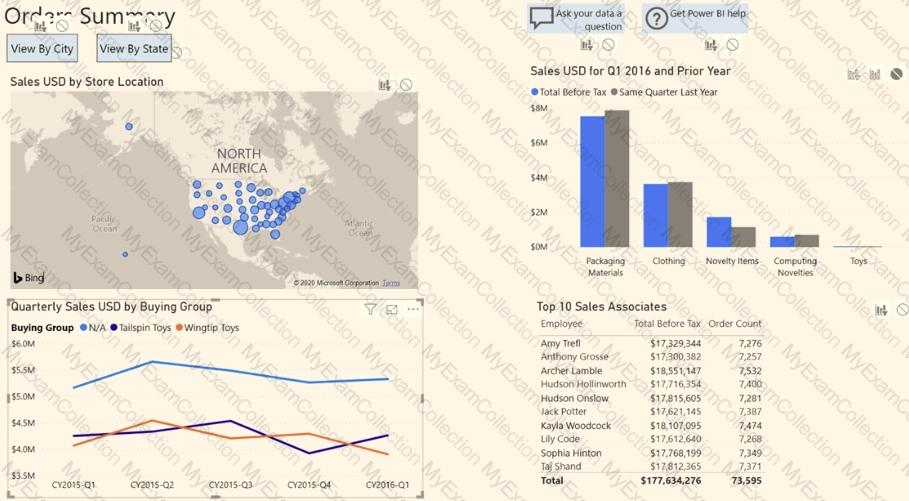
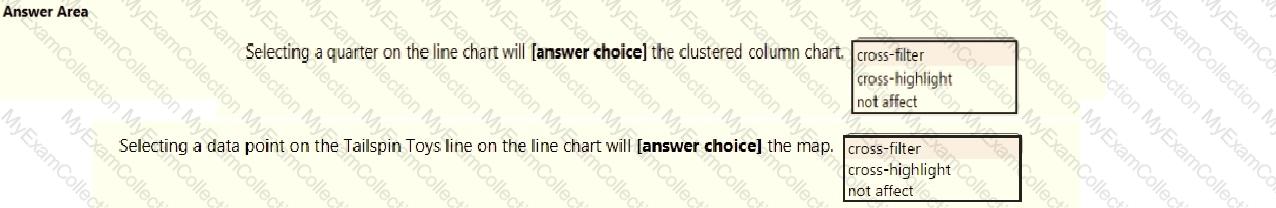
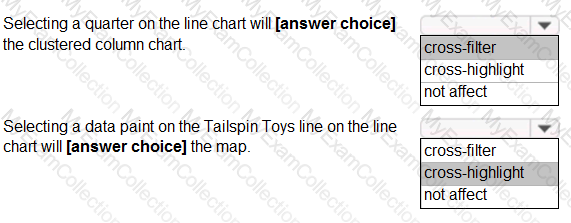
Use the drop-down menus to select the answer choice that completes each statement based on the information presented in the graphic. NOTE: Each correct selection is worth one point.

Question # 9
You are building a Power Bl report that uses data from an Azure SQL database named erp1.
You Import the following tables.
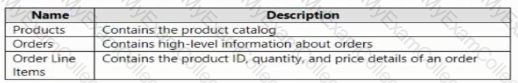
You need to perform the following analyses:
• Orders sold over time that include a measure of the total order value
• Orders by attributes of products sold
The solution must minimize update times when interacting with visuals in the report. What should you do first?
Question # 10
You are creating a quick measure as shown in the following exhibit.
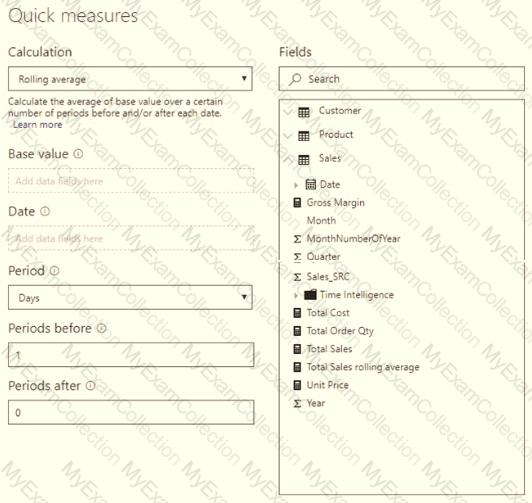
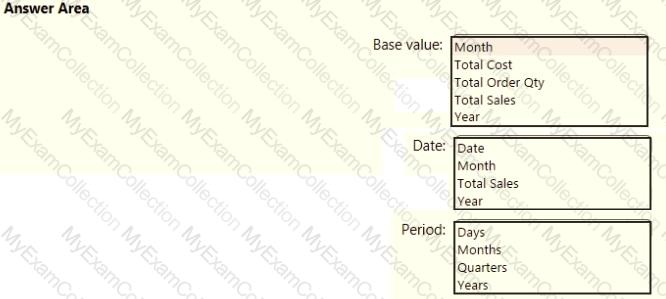
You need to create a monthly rolling average measure for Sales over time-How should you configure the quick measure calculation? To answer, select the appropriate options in the answer area.
NOTE: Each correct selection is worth one point.
Question # 11
Note: This question is part of a series of questions that present the same scenario. Each question in the series contains a unique solution that might meet the stated goals. Some question sets might have more than one correct solution, while others might not have a correct solution.
After you answer a question in this section, you will NOT be able to return to it. As a result, these questions will not appear in the review screen.
You have five reports and two dashboards in a workspace.
You need to grant all organizational users read access to one dashboard and three reports
Solution: In Microsoft Azure Active Directory (Azure AD), part of Microsoft Entra. you create a group that contains all the users. You share each selected report and the one dashboard to the group.
Does this meet the goal?
Question # 12
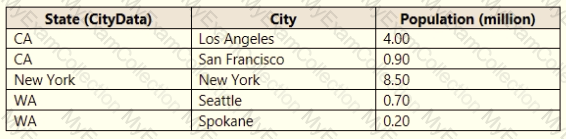
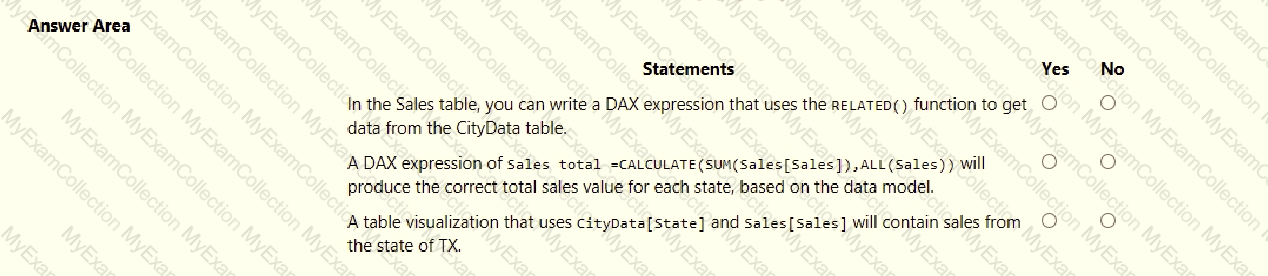
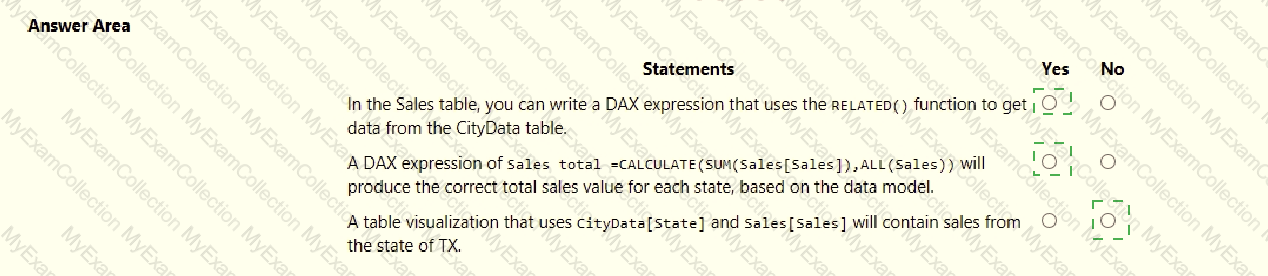
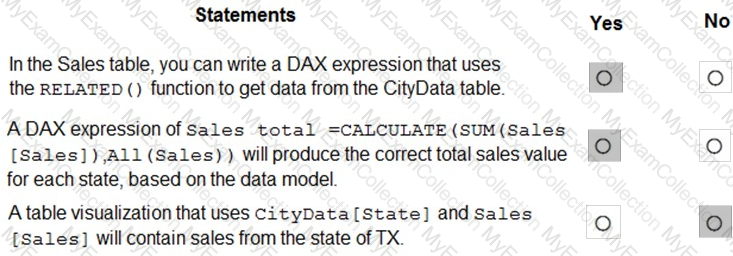
You are creating a Microsoft Power Bl model that has two tables named CityData and Sales. CityData contains only the data shown in the following table.
Sales contains only the data shown in the following table.
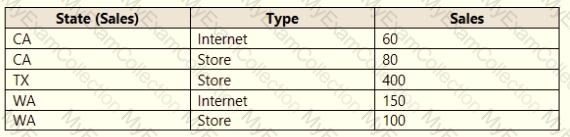
For each of the following statements, select Yes if the statement is true. Otherwise, select No.
NOTE: Each correct selection is worth one point.
 Text
Description automatically generated
Text
Description automatically generated
Question # 13
Note: This question is part of a series of questions that present the same scenario. Each question in the series contains a unique solution that might meet the stated goals. Some question sets might have more than one correct solution, while others might not have a correct solution.
After you answer a question in this section, you will NOT be able to return to it. As a result, these questions will not appear in the review screen.
You are modeling data by using Microsoft Power Bl. Part of the data model is a large Microsoft SQL Server table named Order that has more than 100 million records.
During the development process, you need to import a sample of the data from the Order table.
Solution: You write a DAX expression that uses the FILTER function.
Does this meet the goal?
Question # 14
You need to create a Power Bl theme that will be used in multiple reports. The theme will include corporate branding for font size, color, and bar chart
formatting.
What should you do?
Question # 15
You have a PBiX file that imports several tables from an Azure SQL database.
The data will be migrated to another Azure SQL database.
You need to change the connections in the PBIX file. The solution must minimize administrative effort.
What should you do?
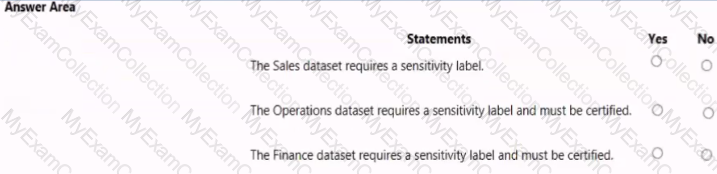
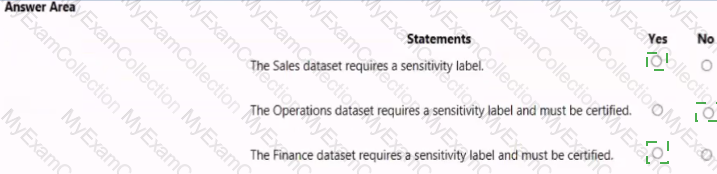
Question # 16
You have a power BI tenant that hosts the datasets shown in the following table.
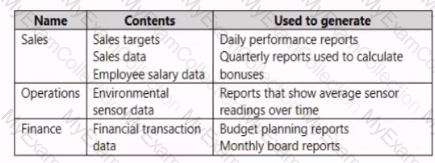
You have the following requirements:
• The export of reports that contain Personally Identifiable Information (Pll) must be prevented.
• Data used for financial decisions must be reviewed and approved before use.
For each of the following statements, select Yes if the statement is true. Otherwise select No. NOTE: Each correct selection is worth one point
Question # 17
You have a Microsoft Power Bl report. The size of PBIX file is 550 MB. The report is accessed by using an App workspace in shared capacity of powerbi.com.
The report uses an imported dataset that contains one fact table. The fact table contains 12 million rows. The dataset is scheduled to refresh twice a day at 08:00 and 17:00.
The report is a single page that contains 15 custom visuals and 10 default visuals.
Users say that the report is slow to load the visuals when they access and interact with the report
You need to recommend a solution to improve the performance of the report.
What should you recommend?
Question # 18
You need to create relationships to meet the reporting requirements of the customer service department.
What should you create?
Question # 19
You have sales data in a star schema that contains four tables named Sales, Customer, Date, and Product.
The Sales table contains purchase and ship dates.
Most often, you will use the purchase date to analyze the data, but you will analyze the data by both dates independently and together.
You need to design an imported dataset to support the analysis. The solution must minimize the model size and the number of queries against the data source.
Which data modeling design should you use?
Question # 20
You need to create a relationship between the Weekly_Returns table and the Date table to meet the reporting requirements of the regional managers. What should you do?
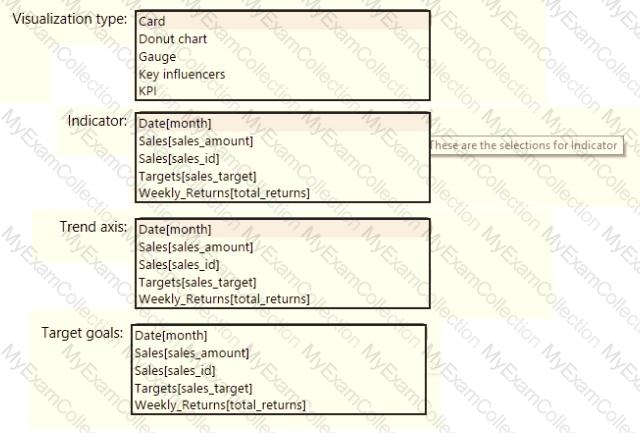
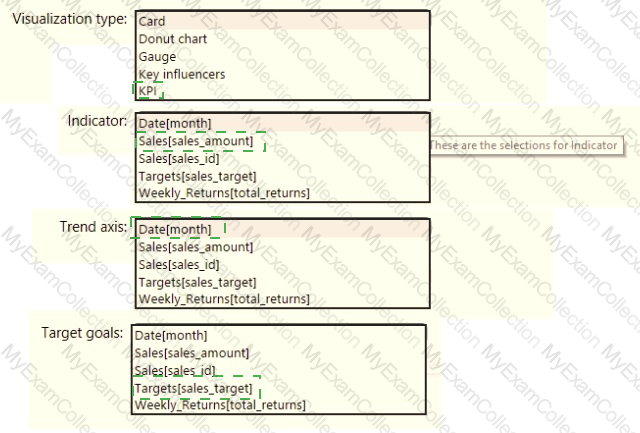
Question # 21
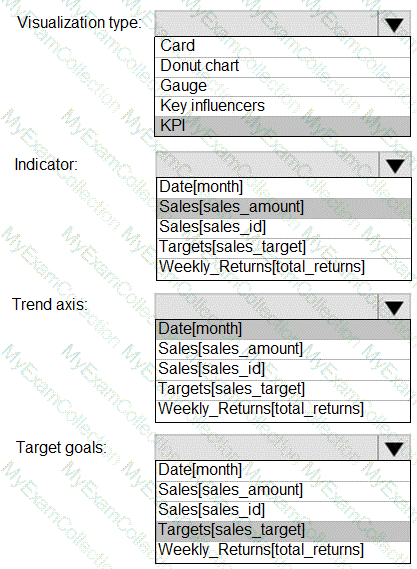
You need to create a visualization to meet the reporting requirements of the sales managers.
How should you create the visualization? To answer, select the appropriate options in the answer area.
NOTE: Each correct selection is worth one point.
Question # 22
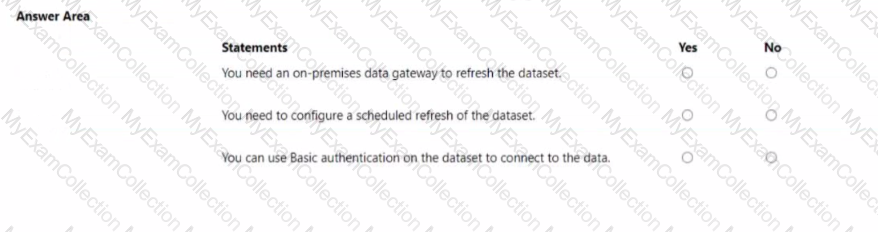
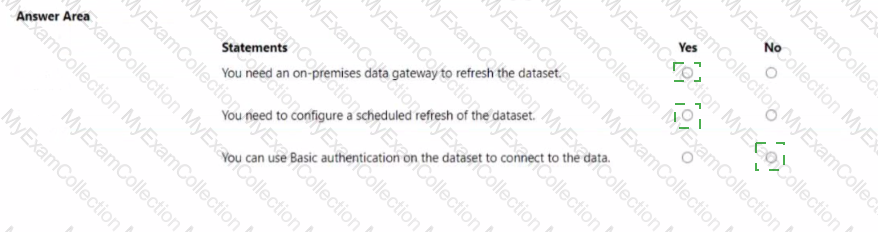
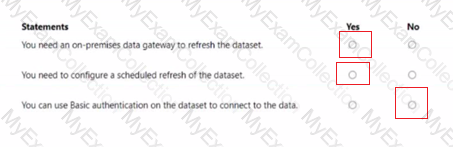
You publish the dataset to powerbi.com.
For each of the following statements, select Yes if the statement is true. Otherwise, select No.
NOTE: Each correct selection is worth one point.
 Graphical user interface, text, application, email
Description automatically generated
Graphical user interface, text, application, email
Description automatically generated
Question # 23
You need to get data from the Microsoft SQL Server tables. What should you use to configure the connection'
Question # 24
You need to provide a solution to provide the sales managers with the required access.
What should you include in the solution?
Question # 25
You need to create a calculated column to display the month based on the reporting requirements. Which DAX expression should you use?
Question # 26
You need to address the data concerns before creating the data model. What should you do in Power Query Editor?
Question # 27
You need to create the required relationship for the executive's visual. What should you do before you can create the relationship?
Question # 28
What should you create to meet the reporting requirements of the sales department?
Question # 29
You merge data from Sales.Region, Region_Manager, Sales_Manager, and Manager into a single table named Region. What should you do next to meet the reporting requirements of the executives?
Question # 30
You need to design the data model to meet the report requirements.
What should you do in Power BI Desktop?
Question # 31
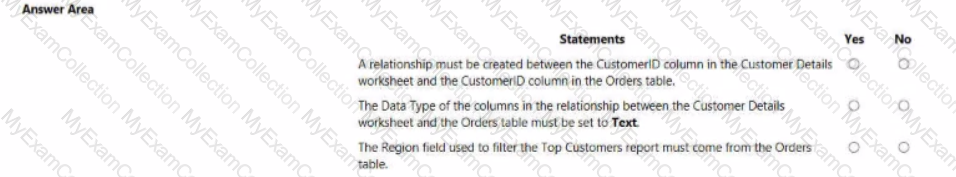
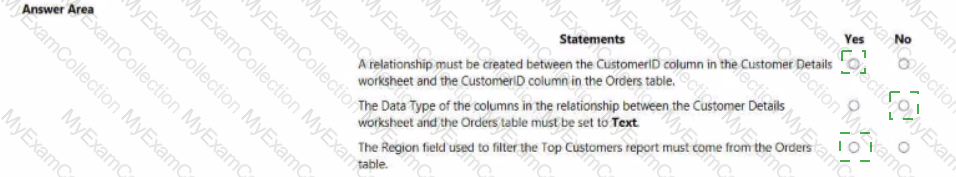
You need to design the data model and the relationships for the Customer Details worksheet and the Orders table by using Power BI. The solution must meet the report requirements.
For each of the following statement, select Yes if the statement is true, Otherwise, select No.
NOTE: Each correct selection is worth one point.
Question # 33
You need to minimize me size of the dataset. The solution must meet the report requirements What should you do?
Question # 34
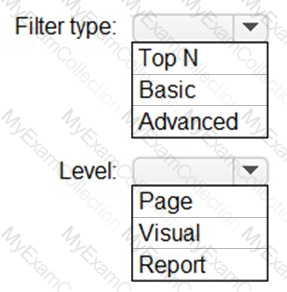
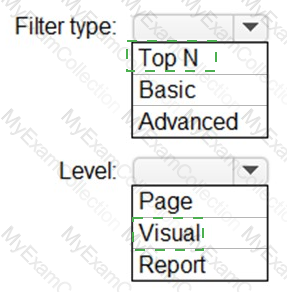
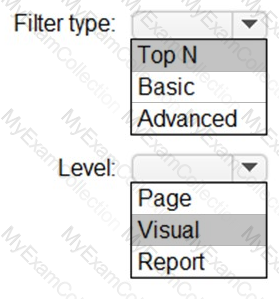
You need to create the Top Customers report.
Which type of filter should you use, and at which level should you apply the filter? To answer, select the appropriate options in the answer area.
NOTE: Each correct selection is worth one point.
 Graphical user interface
Description automatically generated with low confidence
Graphical user interface
Description automatically generated with low confidence
Question # 35
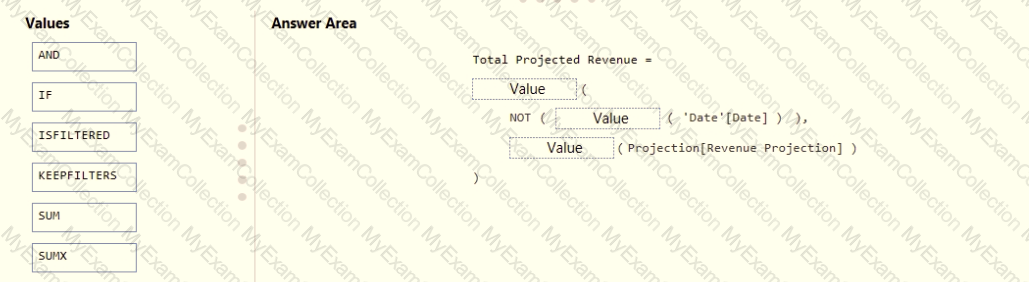
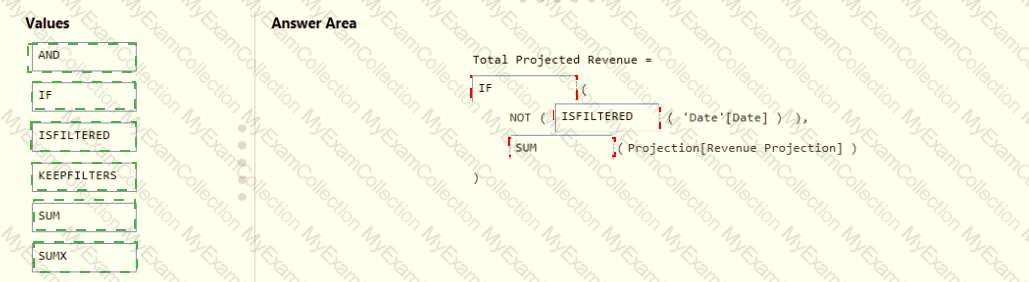
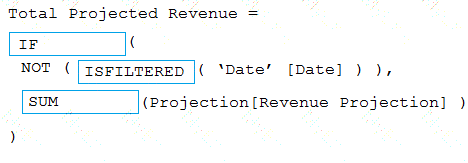
You need to create a DAX measure in the data model that only allows users to see projections at the appropriate levels of granularity.
How should you complete the measure? To answer, drag the appropriate values to the correct targets. Each value may be used once, more than once, or not at all. You may need to drag the split bar between panes or scroll to view content.
NOTE: Each correct selection is worth one point.
Question # 36
Which DAX expression should you use to get the ending balances in the balance sheet reports?
Question # 37
You need to ensure that the data is updated to meet the report requirements. The solution must minimize configuration effort.
What should you do?
Question # 38
You need to create the relationship between the product list and the revenue results. The solution must minimize the time it takes to render visuals.
What should you set as the relationship cardinality?
Question # 39
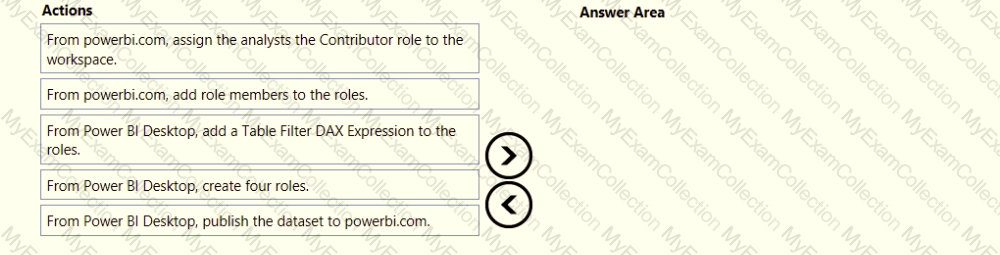
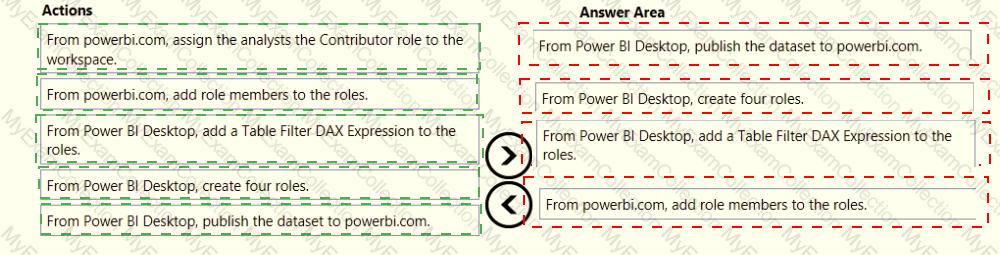
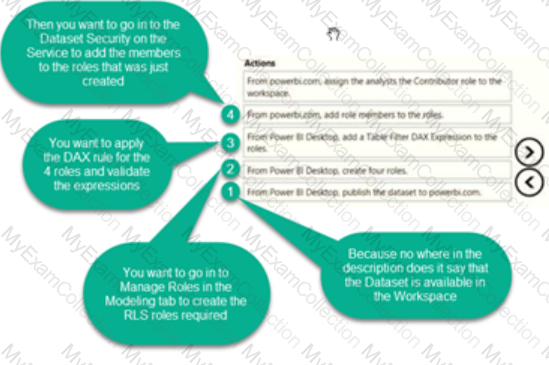
Once the profit and loss dataset is created, which four actions should you perform in sequence to ensure that the business unit analysts see the appropriate profit and loss data? To answer, move the appropriate actions from the list of actions to the answer area and arrange them in the correct order.
Question # 40
What is the minimum number of datasets and storage modes required to support the reports?
Question # 41
Which two types of visualizations can be used in the balance sheet reports to meet the reporting goals? Each correct answer presents part of the solution.
NOTE: Each correct selection is worth one point.
Question # 42
You need to recommend a strategy to consistently define the business unit, department, and product category data and make the data usable across reports.
What should you recommend?
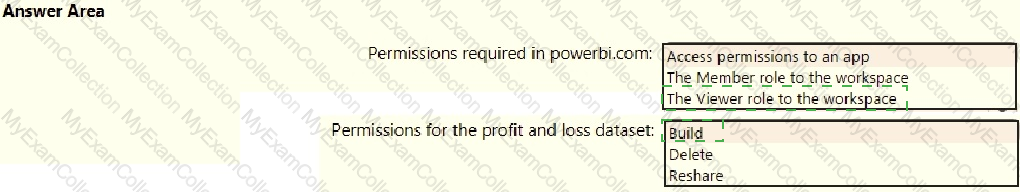
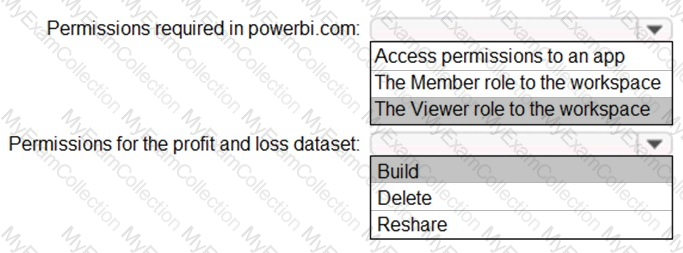
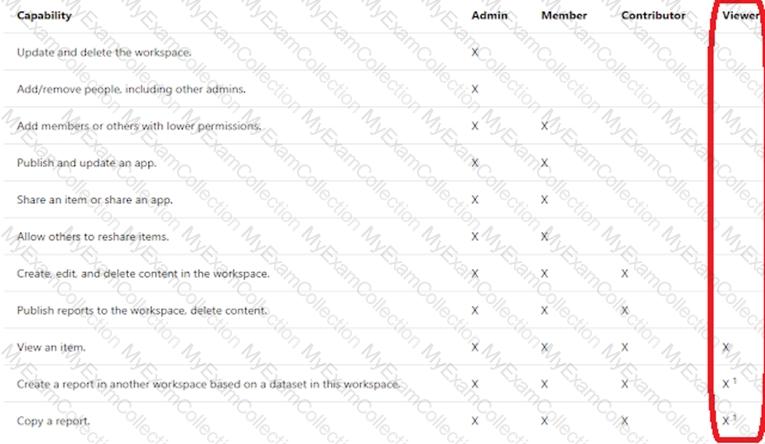
Question # 43
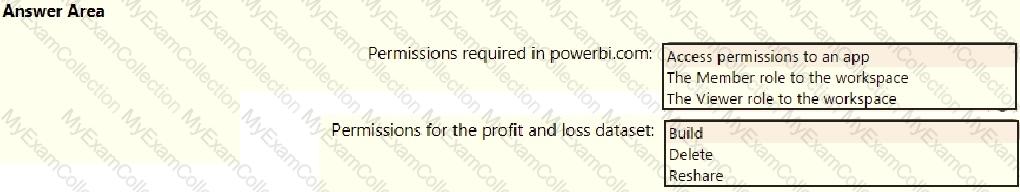
You need to grant access to the business unit analysts.
What should you configure? To answer, select the appropriate options in the answer area.
NOTE: Each correct selection is worth one point.
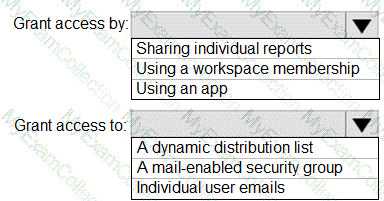
Question # 44
How should you distribute the reports to the board? To answer, select the appropriate options in the answer area.
NOTE: Each correct selection is worth one point.
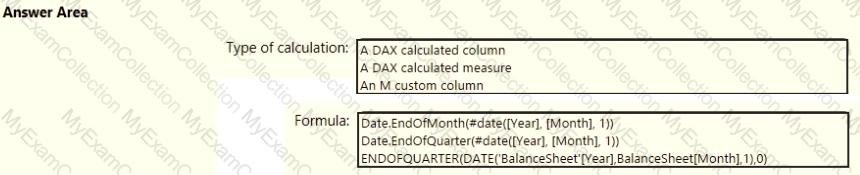
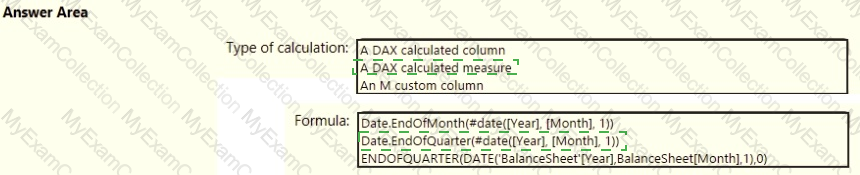
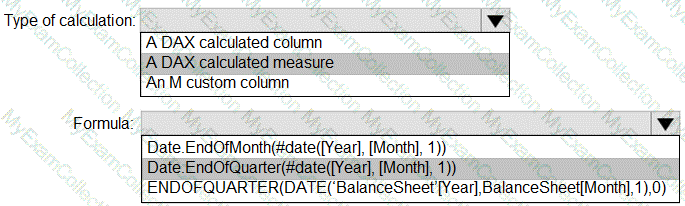
Question # 45
You need to calculate the last day of the month in the balance sheet data to ensure that you can relate the balance sheet data to the Date table. Which type of calculation and which formula should you use? To answer, select the appropriate options in the answer area. NOTE: Each correct selection is worth one point.
Question # 46
You have a Power 31 data model that contains a table named Stores. The table has the following columns:
* Store Name
* Open Date
* Status
* State
* City
You need to create a calculated column named Active Store Name that meets the following requirements:

Question # 47
You are using the key influencers visual to identify which factors affect the quantity of items sold in an order.
You add the following fields to the Explain By field:
* Customer Country
* Product Category
* Supplier Country
* Sales Employee
* Supplier Name
* Product Name
* Customer City
The key influencers visual returns the results shown in the following exhibit.
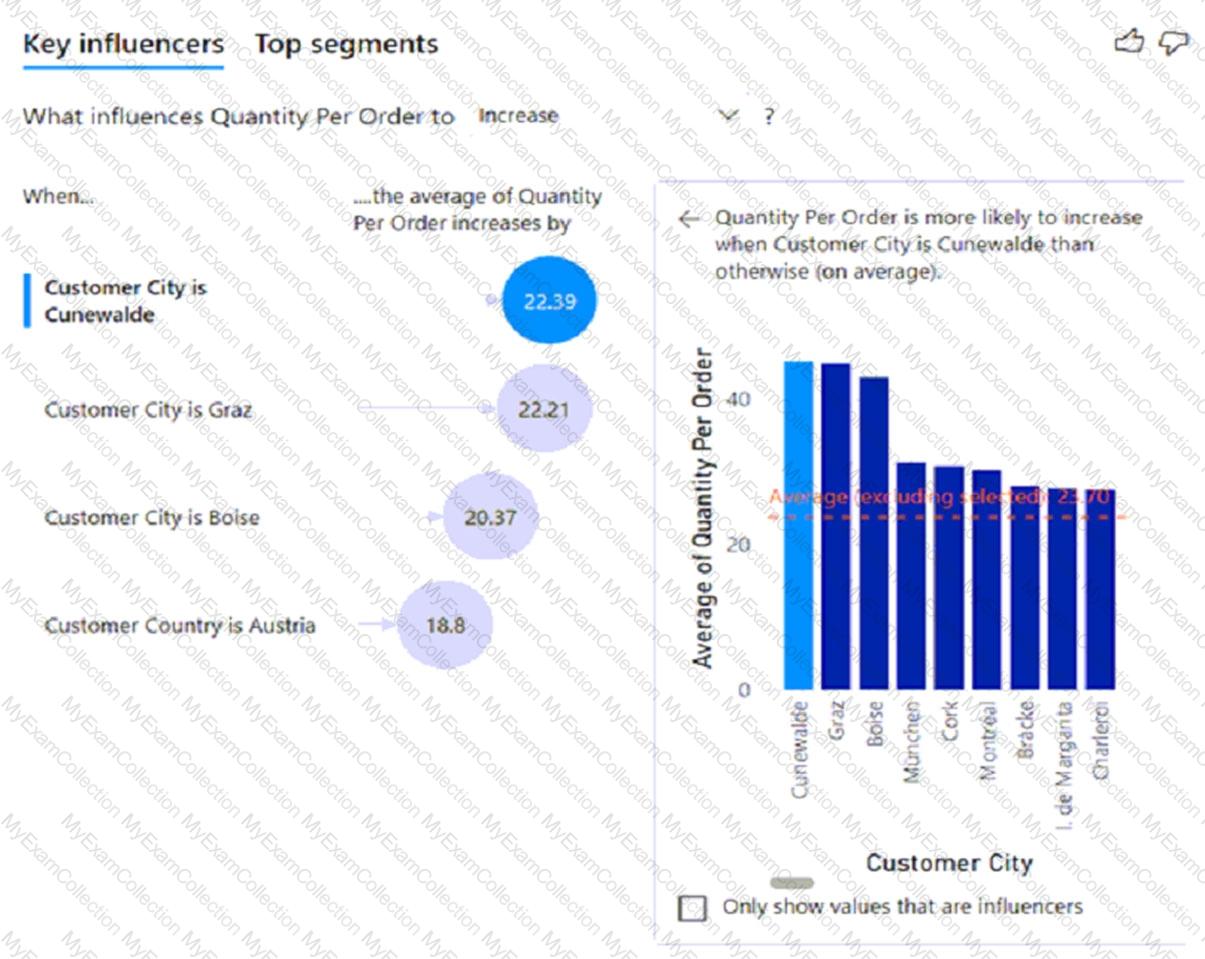
What can you identify from the visual?
Quick Links
Why Us
Unlimited Packages
Site Secure

TESTED 09 May 2024
We Accept